
![]()
Significance of Glomerular PAS Positive Matrix Deposition in Glomerulonephritis
*Das RK,1 Kabir AN,2 Begum F,3 Khanam A,4 Kamal M5
Abstrat:
This study was done with the aim to calculate the glomerular PAS positive material quantitatively in glomerulonephritis and to find out its correlation with renal function. A total of 112 cases of glomerulonephritis were included in this study and morphometric measurements of the percentages of glomerular PAS positive areas were performed in a computer with a specially constructed grid. The mean of these values was scored from 1-4 according to the degree of PAS positive material deposition. With the increase of glomerular PAS positive score the levels of blood urea and serum creatinine also increased but the levels of creatinine clearance rate decreased. The percentages of glomerular PAS positive areas were correlated with renal functions expressed as levels of blood urea, serum creatinine and creatinine clearance rate. The degree of glomerular PAS positive matrix deposition showed strong positive correlation with levels of blood urea and serum creatinine (r=0.566, p<.0.001 and r=0.763, p=<0.001, respectively). Whereas creatinine clearance rate showed striking inverse relationship with PAS positive areas (r= – 0.612, p<0.001). Thus, the present study confirmed the previous results concerning a significant correlation between these parameters.
[Journal of Histopathology and Cytopathology, 2018 Jan; 2 (1):3-10]
Key words: Glomerulonephritis, PAS positive matrix, morphometry, renal function.
- *Dr. Ruhini Kumar Das, Associate Professor, Department of Pathology, M Abdur Rahim Medical College, Dinajpur. dr.ruhini@gmail.com
- AKM Nurul Kabir, Associate Professor, Department of Pathology, Bangabandhu Sheikh Mujib Medical University, Dhaka.
- Ferdousy Begum, Associate Professor, Department of Pathology, Bangabandhu Sheikh Mujib Medical University, Dhaka.
- Anisa Khanam, Associate Professor, Department of Pathology, United Hospital, Dhaka.
- Mohammed Kamal, Professor, Department of Pathology, Bangabandhu Sheikh Mujib Medical University, Dhaka.
*For correspondence
Introduction
Chronic glomerulonephritis is one of the most important causes of chronic renal failure, which is the end result of a variety of human kidney diseases and is the major cause of death.1 It is clear that immune mechanism involved in most of the glomerulonephritis and initial target of injury is the glomerulus of kidney causing glomerular structural abnormalities. Other changes such as interstitial fibrosis, inflammatory infiltrate and tubular atrophy are secondary and nonspecific phenomenon, which are related to the degree of glomerular damage.2 Cell proliferation and deposition of different types of extracellular matrix components in the glomerular basement membrane (GBM) and/or in the mesangium characterizes the histology of glomerulus in glomerulonephritis.3 These changes in the glomerular basement membrane (GBM) and mesangiumare characterized by expansion of all the intrinsic extracellular matrix components due to increased production, decreased turnover or both of these components.4 Immunohistochemical techniques have demonstrated that glomerular extracellular matrix comprises laminin, fibronectin, entectin, heparansulfate, chondroitin sulfate, decorine and various types of collagen.2 Glomerular extracellular matriceses are PAS positive therefore the amount of PAS positive material deposition can reflect the severity of glomerular injury and has been claimed important in predicting renal function in glomerulonephritis.2 Series of histomormphometric studies established that the severity of renal failure in various types of glomerulopathy closely related with the severity of the tubulointerstitial changes, whereas the correlation with glomerular abnormalities is absent or weak.5-11 Critics of these studies were that the severity of interstitial abnormalities was evaluated by quantitative methods whereas the glomerular pathology was studied by semi-quantitative technique.2 Many investigators became puzzled by this apparent lack of correlation between glomerular abnormalities and renal failure although the glomerular pathology is the more important factor in glomerulonephritis and performed the quantitative study with particular interest to the deposition of glomerular PAS positive material. Some studies demonstrated that both glomerular and interstitial extracellular matrix accumulation contribute in impairment of kidney function. In the glomeruli PAS positive extracellular matrix deposition seems to be particularly important and correlate strongly with renal failure,2,4 whereas other failed to find such correlation.13 Therefore, the glomerular deposition of PAS positive matrix is reflected in renal failure has become a controvertial issue. This study was carried out with the aim to calculate the glomerular PAS positive material (% of total glomerular areas) by quantitative technique in glomerulonephritis and to find out its correlation with renal function to confirm this condrovertial issue.
Methods
Patients
This study was carried out in the Department of Pathology, Bangabandhu Sheikh Mujib Medical University (BSMMU), Dhaka. The renal tissues that were examined were collected for clinical purposes by percutaneous kidney biopsy by a surgical procedure. 112 patients of glomerulonephritis, where renal biopsy revealed variable degrees of increased mesangial cells, matrix, hyalinization and sclerosis were selected for this study. Renal tissues containing at least five glomeruli in haematoxylin & eosin stained sections were considered as adequate for evaluation. Blood urea, serum creatinine and creatinine clearance rate (Ccr) were done at the time of biopsy to assess the excretory function of kidney.
Light Microscopy
Tissue for light microscopic examination was fixed in 10% formalin and processed routinely. Sections were cut 4-5 µm thickness from paraffin embedded material and stained by haematoxylin and eosin, periodic acid Schiff (PAS), Masson’s trichrome and methenamine silver (Jones) stains.
Immunofluorescence Microscopy
Renal biopsy specimens were embedded in O.C.T. compound, rapidly frozen, then sectioned at 5µm thickness in a cryostat at -200c. The sections were stained with FITC conjugated rabbit anti-sera against human IgG, IgM, IgA, C3 and fibrinogen. The sections were then viewed under fluorescence microscope.

Figure 1. A grid superimposed on a glomerulus in the biopsy of a patient with mesangiocapillary glomerulonephritis using Adobe illustrator 8.0. Total 48 points superimposed on glomerular area within Bowman’s capsule, 9 points superimposed on PAS positive area. The resulting PAS positive area was 18.8%.
Morphometry
Histomorphometry was performed by means of an image analysis system in a computer using Adobe Illustrator 8.0. Glomerular deposition of PAS positive material (% of total glomerular area) was measured quantitatively by morphometric examination of three to five glomeruli in PAS stained sections. Tangentially cut glomeruli were excluded. A section in which the apparent diameter was <50% of maximum diameter was defined as tangential section. The quantitative examination included the areas of glomerular deposition of PAS positive material of the total glomerular area. This was performed by means of a point counting method, which has been described as an accepted standard for histomorphometric evaluation. Colour microphotographs were taken by means of an Olympus digital camera (DP 11, Japan) which was attached to an Olympus microscope (BX51TF, Japan). The original magnification was 200 X. The colour microscopic images were transferred to a computer and saved in the memory. A grid was prepared in the computer using Adobe Illustrator 8.0. The space between the intersecting points of the grid was 6.25 mm. The total number of points of the grid was 169, and total area was 5625 sq.mm. The images of a glomerului were reduced to 20% of its original size and the grid projected over it (Fig. 1). The total glomerular areas were determined by counting the numbers of intersecting points superimposed on glomerular areas within Bowman’s capsule. The percentage of PAS positive material was represented by numbers of points falling on PAS positive material as percentage of total points falling on total structure within Bowman’s capsule. To minimize the error each glomerulus was measured three times by changing the position of grid. The mean of these values for each glomerulus was calculated and scored from 1- 4 according to degree of PAS positive areas (Table I).
Table I: Scoring system of glomerular PAS positive material
| Glomerular PAS positive area. | Score |
| Up to 10% of the glomerular PAS positive area | 1 |
| >10-25% of the glomerular PAS positive area | 2 |
| >25-50% of the glomerular PAS positive area | 3 |
| >50% of the glomerular PAS positive area | 4 |
Statistics
The correlations of glomerular PAS staining areas with renal function were determined with Pearson’s correlation method. Results were statistically significant if p <0.05.
Results
Of the total 112 cases, 55 (49.1%) were mesangial proliferative glomerulonephritis (Mes PGN), 45 (40.2%) were mesangiocapillary glomerulonephritis (MCGN), 8 (7.1%) were IgA nephropathy (IgAN), 3 (2.7%) were membranous glomerulonephritis (MGN) and 1 (0.9%) was chronic glomerulonephritis (CGN). The glomerular PAS positive material ranged from 8.46% to 56.73% with a mean value of 20.71 ± 7.9%. The mean values of glomerular PAS positive areas in MesPGN, MCGN, IgA nephropathy, MGN and CGN were 19.46 ± 6.3%, 22.31 ± 8.1%, 15.69 ± 3.9%, 31.05 ± 22.3% and 27.04% respectively. PAS positive areas were scored from 1 to 4 (Table II).
Table II: Score of glomerular PAS positive areas
| Score | PAS positive area
(Mean ± SD) |
No. of patients
n = 112 |
| 1 | 9.14 ± 0.77% | 4 |
| 2 | 18.31 ± 4.05% | 85 |
| 3 | 29.38 ± 5.25% | 21 |
| 4 | 54.88 ± 2.61% | 2 |
Out of 112 cases estimation of blood urea was done in 107 cases, creatinine clearance ratevin 100 cases and serum creatinine in all of the cases. It was observed that with the increase of glomerular PAS positive score the levels of blood urea and serum creatinine also increased whereas the levels of Ccr decreased (Fig. 2). Glomerular PAS positive areas showed significantly strong positive correlation with the levels of blood urea and serum creatinine (r = 0.566, p <0.001 and r = 0.763, p <0.001, respectively), whereas with Ccr the relationship was significantly inverse (r = – 0.612, p < 0.001) (Fig. 3-5).
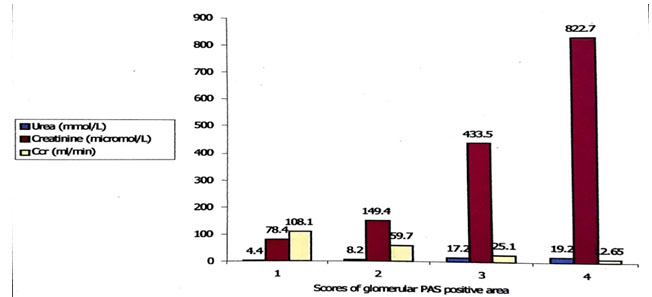
Figure 2. Result of renal function tests according to score of PAS positive areas

Figure 3. Correlation between glomerular PAS positive area and blood urea
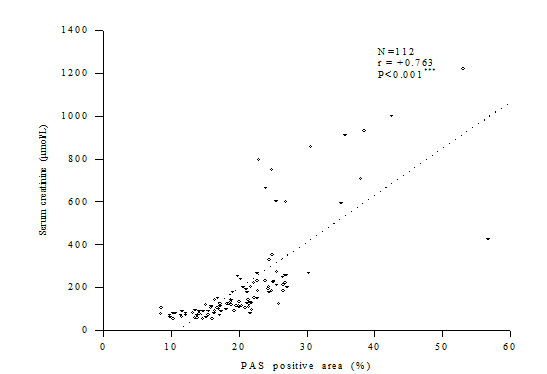
Figure 4. Correlation between glomerular PAS positive area and serum creatinine

Figure 5. Correlation between glomerular PAS positive area and creatinine clearance rate
Discussion
In many of the glomerulonephritis there is deposition of PAS positive extracellular matrix in GBM and mesangium and glomerular PAS positive areas correlate with renal function expressed as blood urea, serum creatinine and creatinine clearance.
With this aim Suzuki in 1994 performed a quantitative study on diabetic nephropathy. He stained glomerular mesangial deposition of various glycoproteins with PAS and measured the positive areas by an automatic image analyzer. He correlated the percentages of glomerular PAS positive areas with serum creatinine and found significant correlation.4
In 1997, Vleming and co-authors performed a quantitative study on various forms of glomerular diseases to find out the correlation of glomerular PAS positive areas with renal function. They found that the percentages of glomerular PAS positive areas correlated strongly with renal insufficiency expressed as serum creatinine.2
In view of the same aim Danilewicz and Wagrowska Danilewicz in 1997 carried out a quantitative study on three forms of proliferative glomerulonephritis MesPGN, MCGN and IgA nephropathy. They failed to demonstrate any significant correlation between glomerular PAS positive matrix deposition and serum creatinine. These investigators found that correlation between these parameters tended to be positive but have not reached statistical significance. They could not agree with the earlier findings of Vleming et al 1997 and stated that in their study patients biopsies contained a mixed bag of diagnosis. Therefore, this would require external validation of their findings in a cohort of patient with one disease.13
Vleming and co-authors in 1998 performed another quantitative study with a single disease entity for confirmation of their previous findings of significant positive correlation of glomerular PAS positive material with renal function. IgA nephropathy was selected and obtained significant correlation between glomerular PAS positive areas and creatinine clearance rate at the time of biopsy.14
The present study was performed to measure glomerular PAS positive material quantitatively and to determine whether this parameter correlates with renal function. It was observed that with the increase of PAS positive scores the level of blood urea and serum creatinine also proportionately increased whereas the level of creatinine clearance rate decreased. The glomerular PAS positive areas correlated strongly with the levels of blood urea, serum creatinine and Ccr. Our results correspond to the observation of Vleming et al. 1997, Vleming et al. 1998 and Suzuki 1994. The findings of present study only differ with the study of Danilewicz et al. 1997. They did not find significant correlation between PAS positive areas and serum creatinine in MesPGN, MCGN and IgAN. Total number of cases in their study was small and they have included only less severe cases of glomerulonephritis. This may be the possible cause of insignificant correlation in their study.
Conclusion
It was concluded that the severity of glomerular PAS positive matrix accumulation in glomerulonephritis correlated with the severity of renal insufficiency and our study confirmed the results previously obtained by different observers concerning significant correlation between these parameters.
Acknowledgment
We acknowledge Bangladesh Medical Research Council (BMRC) for their support by a research grant for this study under WHO Research Programme.
References
- Cotran RS, Kumar V, Collins T. (Eds). Robbins Pathologic Basis of Disease, 6th Philadephia: WB Saunders, 1999: 931-64.
- Vleming LJ, Baelde JJ, Westendorp RGJ, Daha MR, Es van LA, Bruijn JA and Bruijn JA. The Glomerular deposition of PAS positive material correlates with renal function in human kidney diseases. Clin Nephrol, 1997; 47: 158-167.
- Glick AD, Jacobson HR, Haralson MA. Mesangial deposition of type 1 collagen in human glomerulosclerosis. Hum pathol, 1992; 23: 1373-7.
- Suzuki D. Measurement of the extracellular matrix in glomeruli from patients with diabetic nephropathy using an automatic image analyzer. Japanese Journal of Nephrology, 1994; 36 (11): 1209-1215.
- Risdon RA, Sloper JC, De Wardener HE. Relationship between renal function and histological changes found in renal-biopsy specimens from patients with persistent glomerulonephritis. Lancet, 1968; 2: 363-366.
- Schainuch LI, Striker GE, Cuter RE, Bendin EP. Structural-functional correlations in renal diseases. II. The correlations. Hum Pathol, 1970; 1:630-641.
- Bohle A, Mackensen-Heam S, von Gise H. Significance of tubulointerstitial changes in the renal cortex for the excretory function and concentration ability of the kidney. A morphometric comparison. Am J Nephrol, 1987; 7: 42-433.
- Mackensen-Heam S, Bohle A, Christensen J, Wehrmann M, Kendjiora H, Kokot F. The consequences for renal function of widening of the interstitium and changes in the tubular epithelium of the renal cortex and outer medulla in various renal diseases. Clin Nephrol, 1992; 37:70-77.
- Lane PH, Steffes MW, Fioretto P, Mauer M. Renal interstitial expansion in insulin-dependent diabetes mellitus. Kidney International, 1993; 43: 661-667.
- Steffes MW, Bilous RW, Sutherland DER, Mauer SM. Cells and matrix components of the glomerular mesangium in type I diabetes. Diabetes, 1992; 41:679-84.
- Mauer SM, Steffes MW, Ellis EN, Sutherland DE, Brown DM, Goetz FC. Structural-functional relationships in diabetic nephropathy. J Clin Invest, 1984; 74:1143-1155.
- Thomsen OF, Andersen AR, Christiansenis A and Deckert T. Renal changes in long-term type I (insulin-dependent) diabetic patients with and without clinical nephropathy: a light microscopic, morphometric study of autopsy material. Diabetilogica, 1984; 26: 361-365.
- Danilewicz M and Wagrowska- Danilewicz M. The consequences for renal function of the glomerular deposition of PAS positive material in proliferative glomerulopathies. A quantitative study. Gen Diag Pathol, 1997; 143: 225-230.
- Vleming LJ, Fijter DE JW, Westendorp RGJ, Daha MR, Bruijn JA and Es van LA,. Histomorphometric correlates of renal failure in IgA nephropathy. Clin Nephrol,1998;49:337-344.