
![]()
Correlation of Proliferation Index and Microvessel Density in Glial Tumors with WHO Tumor Grades
*Begum A,¹ Kamal M²
Abstract
This study was carried out to find the association of proliferative index (PI) and microvessel density (MVD) in different histo-morphological grades of glial tumor according to WHO criteria. Paraffin embedded tissue blocks of 42 patients with glial tumors were included in this study. Ki-67 and CD 34 immunostaining were done in all cases and was compared with the WHO grade. Proliferation indix was detected by Ki-67 immunostaining and micro vessel densitywas detected by CD 34 immunostaining in glial tumors. Glial tumor was common in 3rd decade with male predominance. Most common location of glial tumor was frontal lobe 19.0%. Anaplastic astrocytoma (WHO grade III) in 21.4% cases and glioblastoma multiforme (WHO grade IV) in 21.4% cases was diagnosed commonly. Glioblastoma multiforme (WHO grade IV) had mean proliferative index 24.3±8.7%, anaplastic astrocytoma (WHO grade III) had 25.1±12.4%, diffuse fibrillary astrocytoma, (WHO grade II) 4.5±3.7% and pilocytic astrocytoma (WHO grade I) had 2±0.8%. The mean proliferative index difference was statistically significant (p<0.05) in different WHO grades. Glioblastoma multiforme (WHO grade IV) had mean MVD 100.11±46.62, anaplastic astrocytoma (WHO grade III) had 57.13±20.14, diffuse fibrillary astrocytoma (grade II) had 32.0±12.01 and pilocytic astrocytoma (WHO grade I) had 47.75±19.91. The microvessel density difference was statistically significant (p<0.05) in different WHO grades. A weak positive correlation was found between proliferative index and microvessel density in the 42 patients of glial tumors. Patients of low grade glial tumor with increased proliferative index and microvascular proliferation are at risk of progressing to higher grade tumor.
[Journal of Histopathology and Cytopathology, 2017 Jul; 1 (2):91-101]
Key words: Glial tumors, Tumor grades, Proliferation index, Ki-67 Labeling index, CD34, Microvessel density (MVD)
- *Dr. Afroza Begum, Assistant Professor of Pathology, Anwer Khan Modern Medical College and Hospital, Dhaka. afroza.mithila@gmail.com
- Mohammed Kamal, Professor, Department of Pathology, Bangabondhu Sheikh Mujib Medical University, Dhaka.
*For correspondence
Introduction
Glial tissue neoplasm is the most common intracranial tumors. Worldwide incidence of primary brain tumors is approximately seven per 100,000 individuals per year, accounting for 2% of all primary tumors1 40% of all primary Central Nervous System (CNS) tumors are Gliomas. 75% of which are Astrocytomas. Ependymomas, oligodendrogliomas and other subtypes includes the rest 25 %.2 Pathologic diagnosis of gliomas depends on established histopathologic criteria after examination of hematoxylin and eosin (H&E) stained slides of sampled tissue and grading on the basis of cellularity, nuclear atypia, mitotic activity, pseudopalisading necrosis and/or microvascular proliferation according to WHO classification of CNS neoplasms.3
Prognosis depends on several factors like age, preoperative status, extent of resection, and histopathological WHO grades along with mitotic count and necrosis in glial tumor. Prediction of clinical outcome in individual patient on the basis of grade alone is impossible as same tumor grade may behave differently. A continuous search for auxillary diagnostic and prognostic markers resulted for this limitation. Increased proliferative activity of tumor cells and micro vascular proliferation in tumor are associated with more aggressive tumor behavior and immunohistochemical techniques have been employed to quantitatively assess proliferative activity and micro vessel density in tumor tissue. The most reliable method to assess cell proliferation in gliomas is the antibody against Ki-67 antigen. The MIB-1 antibody identify a non-histone nuclear matrix protein associated antigen Ki-67 present in the nuclei of cells in the G1, S, G2 and M phases of the cell cycle, but is not expressed in the resting G0 phase.4
Proliferation indices less than 1.5% were associated with longer survival and higher then 1.5% had shorter survivals. Proliferation index was particularly useful in WHO grade II and III tumors, as it identifies aggressiveness.5 However, a significant positive correlation between Ki-67 indices and histologic grade have demonstrated in many investigations and observed higher Ki-67 proliferation indices associated with shorter survivals. So, both the WHO grade and proliferation index have prognostic predictive value.4
CD 34 is used as an endothelial cell marker in order to study vascular proliferation in glial tumor; specially astrocytomas.6 Microvascular density is a measure of microvascular proliferation, which is also an independent prognostic factor for adult glioma.7 Angiogenesis is rate limiting for tumor growth, and therefore a rational therapeutic target.1.
The association of PI and MVD with different WHO grade of glial tumors has not been studied till now in Bangladesh. Results of studies by various authors in different countries show proliferation index and MVD correlate with different WHO grades of glial tumors and also in some cases, can predict progression of tumor from lower grade to higher grades. The aim of this study was to investigate the association of proliferative index measured with Ki-67 and microvessel density measured by CD34 with different histo-morphological grades of glial tumor according to WHO.
Methods
Paraffin embedded tissue blocks of primary brain tumor diagnosed at the department of Pathology, BSMMU and other private pathology of Dhaka city were collected from the archive from the year 2012 to 2013. Forty two cases were selected for the study. Clinically suspected glial tumor but subsequently proved to be non-neoplastic conditions like demyelinating disease or reactive gliosis on histological examination, any CNS tumor other than glial tumor or metastatic tumor to CNS and samples without clinical data were excluded.
Collection of clinical information
Detailed clinical information was obtained by taking history recorded in clinical proforma of departmental archives. Filling up of the clinical proforma was performed in all cases.
Sectioning and staining of paraffin embedded tissue blocks for routine histopathological examination: The sections were cut and stained with haematoxylin and eosin (H&E) staining method by using auto-stainer (Varistain 24-4 Automatic Slide Stainer, Thermo Scientific, USA) following standard protocol. PAS staining of the slides were done according to the standard protocol followed at BSMMU and was used for the detection of three hot spots (area showing maximum vascularity) in the tissue sections. Slides of all cases were examined in light microscope after mounting in DPX.
Methods used for immunohistochemistry (IHC)
For IHC stain, 2-3 µm thick tissue sections were taken from the paraffin blocks on coated slide (DAKO, codeK8020). DAKO EnVision™+/HRP (Horseradish peroxidase) system which is based on advance Labeled Streptavidin-biotin (LSAB) method was used for visualizing the section. These methods were carried out manually.
Scoring of Ki-67
It is done by the percentage of tumor cell nuclei allowing Ki-67 staining per total of 1000 neoplastic cells. One thousand tumor cells were counted in several areas of tissue where positively stained nuclei were evenly distributed. But in those cases with uneven distribution of positive nuclei, the tumor cells were counted in the areas with highest density of positive nuclei by visual analysis.8 In this study, 500 neoplastic cells were calculated and percentages of Ki-67 stained neoplastic cells were determined. Usually proliferative index of glial tumor with WHO grade-I has 0 to 3.9%, WHO grade-II has up to 4%, WHO grade-III has 5 to 10% and WHO grade-IV has 15 to 20% (WHO classification of tumors of the CNS, IARC, Lyon, 2007).
MVD calculation
Brown staining of cytoplasm of endothelial cells with CD 34 was considered positive reaction. MVD were calculated according to Weidner’s method. At first the sections were scanned at low power (X10) looking for hot spots. Hot spot is an area with the most dense vessels growth. Only hot spots close to the tumor cell clusters in viable areas (non-necrotic and non-sclerotic areas) were included. When the hot spots were defined, microvessel count (MVC) was performed by counting the individual stained microvessels (at power X20) representing a field size of 0.74mm² (20X objective, 10X ocular; equivalent to 0.7386 mm² per 200X field.9 First three hot spots were chosen. In each hot spot, MVC was performed at power X20. Finally MVD was calculated as the mean of the total number of microvessels in these three hot spots.
Statistical analysis
Statistical analyses of the results were obtained by windows based computer software devised with Statistical Packages for Social sciences (SPSS-17). The qualitative data were presented as numbers and percentages while the quantitative data were presented as mean, standard deviations and ranges. The results were calculated by using statistical formulae Chi-square test and and Fisher exact test was used only when the expected count in any cell found less than 5. Also the comparison between two groups with quantitative data was done by using Independent t-test and the comparison between three groups with quantitative data was done by using One Way ANOVA. Pearson correlation coefficient was used to assess the relations between the studied parameters.
Results
The mean age was found 35.38±17.55 years with range from 4 to 82 years, highest occurrences observed in 3rd decade (31.0%) and almost three fourths 31 (73.8%) patients were male. Male female ratio was 2.8:1. Frequent site of involvement were frontal lobe 8 (19.0%) cases, parietal lobe 6 (14.3%) cases and temporal lobe 6 (14.3%) cases. (Table I)
Table I: Age, sex and tumor location in study cases
| Clinical Variables | Results |
| Age in years | |
| Mean±SD | 35.38±17.55 |
| Range (min-max) | 4-82 |
| Gender | N (%) |
| Male | 31(73.8 %) |
| Female | 11(26.2 %) |
| Location of tumors | |
| Frontal lobe | 8(19.0 %) |
| Parietal lobe | 6(14.3 %) |
| Temporal lobe | 6(14.3 %) |
| Temporoparietal lobe | 4(9.5 %) |
| Frontoparietal lobe | 2(4.8 %) |
| Frontotemporal lobe | 2(4.8 %) |
| Parieto-occipital lobe | 2(4.8 %) |
| Cerebral | 4(9.5 %) |
| Spinal | 2(4.8 %) |
| Ventricle | 2(4.8 %) |
| Corpus callosum | 1(2.4 %) |
| Cerebellum | 1(2.4 %) |
| Posterior fossa | 2(4.8 %) |
9 (21.4%) patient had anaplastic astrocytoma, WHO grade III and glioblastoma multiforme WHO grade IV respectively and 6 (14.3%) cases had diffuse fibrillary astrocytoma WHO grade II. According to WHO grading majority 17 (40.7%) patients had grade II lesion followed by 12 (28.6%) had grade III lesion, 9 (21.4%) had grade IV lesion and 4 (9.5%) had grade I lesion. Anaplastic astrocytoma, WHO grade III had mean mitotic count 6.56±2.3 /10HPF ranging from 4 to 11 /10HPF. The glioblastoma multiforme WHO grade IV had mean mitotic count 8.11±2.76 /10HPF ranging from 5 to 12 /10HPF. Other results are depicted in this table. The mean difference was statistically significant (p<0.05). The findings are shown in table II.
All (100.0%) patients with glioblastoma multiforme WHO grade IV had necrosis and necrosis was not found in the remaining cases. Four patients had pilocytic astrocytoma WHO grade I among them 3(17.6%) had mild and 1(10.0%) had moderate nuclear pleomorphism. Nine patients had anaplastic astrocytoma, WHO grade III among them 1(5.9%) had mild, 5(50.0%) had moderate and 3(21.4%) had marked nuclear pleomorphism. Nine patients had glioblastoma multiforme WHO grade IV among them 2(20.0%) had moderate and 7(50.0%) had marked nuclear pleomorphism. Other results are depicted in this table VI. The difference was statistically significant (p<0.05) between three groups (Table: II).
Table II: Histopathological findings in different glial tumors of different grades
| Histopathological Diagnosis | WHO grades | N (%) | Nuclear pleomorphism | Cellularity (No. of cells/ HPF) |
Mitoses/
10HPF |
||
| Mild (n=18) |
Moderate (n=10) |
Marked (n=14) |
|||||
| N (%) | N (%) | N (%) | Mean±SD | Mean±SD | |||
| Pilocytic astrocytoma | I | 4(9.5) | 3(17.6) | 1(10.0) | 0(%) | 159.5±75.2 | 1.67±0.58 |
| Diffuse fibrillary astrocytoma | II | 6(14.3) | 5(29.4) | 0(0.0) | 1(7.1) | 325.2±102.14 | 2.17±0.75 |
| Ependymoma | 5(11.9) | 5(29.4) | 0(0.0) | 0(0.0) | 249.0±97.58 | 2.80±1.10 | |
| Gemistocytic astrocytoma | 2(4.8) | 1(5.9) | 0(0.0) | 1(7.1) | 234.5±31.82 | 6.0±1.41 | |
| Oligoastrocytoma | 2(4.8) | 2(11.8) | 0(0.0) | 0(0.0) | 188.3±104.07 | 2.50±0.71 | |
| Oligodendroglioma | 2(4.8) | 1(5.9) | 1(10.0) | 0(0.0) | 182.0±25.46 | 2.00±1.41 | |
| Anaplastic astrocytoma | III | 9(21.4) | 1(5.9) | 5(50.0) | 3(21.4) | 602.67±44.06 | 6.56±2.30 |
| Anaplastic ependymoma | 3(7.1) | 0(0.0) | 1(10.0) | 2(14.3) | 385.11±167.27 | 6.00±2.00 | |
| Glioblastoma multiforme | IV | 9(21.4) | 0(0.0) | 2(20.0) | 7(50.0) | 503.89±130.92 | 8.11±2.76 |
| P | 0.003s | 0.001s | 0.001s | ||||
Anaplastic astrocytoma WHO grade III had mean proliferative index 25.1±12.4% ranging from 8.8% to 40% (fig 1 and 2). The glioblastoma multiforme WHO grade IV had mean proliferative index 24.3±8.7% ranging from 15% to 40%. The gemistocytic astrocytoma WHO grade II had mean proliferative index 10.8±10.3% ranging from 3.5% to 18%. The anaplastic ependymoma WHO grade III had mean proliferative index 18.0±7.6% ranging from 10% to 25%. The mean difference was statistically significant (p<0.05).
Anaplastic astrocytoma WHO grade III had mean MVD 57.13±20.14 ranging from 35 to 87. The glioblastoma multiforme WHO grade IV had mean MVD 100.11±46.62 ranging from 38 to 197 (fig 3 and 4). The oligoastrocytoma WHO grade II had mean MVD 110.5±68.59 ranging from 62 to 159. The mean difference was statistically significant (p<0.05) (Table III).
A positive correlation was found between proliferative index and microvessel density. The value of Spearmen’s correlation coefficient was 0.244 and it is not significant (p=0.119). Therefore, there was a weak association between proliferative index and microvessel density in the study population but not statistically significant (fig 5).
Table III: Proliferative index with histological diagnosis and WHO grades of different glial tumors
| Histopathological Diagnosis | WHO grades | N (%) | Proliferative index, Ki67 (%) | Microvessel density,CD34 |
| Mean±SD | Mean±SD | |||
| Pilocytic astrocytoma | I | 4(9.5) | 2.0±0.8 | 47.75±19.91 |
| Diffuse fibrillary astrocytoma | II | 6(14.3) | 4.5±3.7 | 32.0±12.01 |
| Ependymoma | 5(11.9) | 3.0±3.1 | 41.0±19.58 | |
| Gemistocytic astrocytoma | 2(4.8) | 10.8±10.3 | 32.0±18.38 | |
| Oligoastrocytoma | 2(4.8) | 1.6±0.6 | 110.5±68.59 | |
| Oligodendroglioma | 2(4.8) | 1.0±0.0 | 52.0±5.66 | |
| Anaplastic astrocytoma | III | 9(21.4) | 25.1±12.4 | 57.13±20.14 |
| Anaplastic ependymoma | 3(7.1) | 18.0±7.6 | 51.0±25.94 | |
| Glioblastoma multiforme | IV | 9(21.4) | 24.3±8.7 | 100.11±46.62 |
| P-value | 0.001s | 0.002s |

Fig 1. Photomicrograph of a diffuse fibrillary astrocytoma, WHO grade II (Ki67 immunosatin, x220)

Fig 2. Photomicrograph of anaplastic astrocytoma WHO grade-III. Many Ki67 positive cells are present (Ki-67 immunostain, x220)
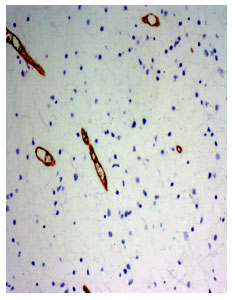
Fig 3. Photomicrograph of a diffuse fibrillary astrocytoma WHO grade-II (CD34 immunostain x210)
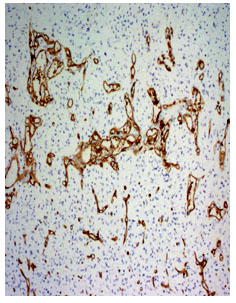
Fig 4. Photomicrograph shows glioblastoma multiformi WHO grade-IV (CD34 immuno stain, x210)

Fig 5. Scatter diagram showing Spearmen’s positive correlation (r=0.244; p=0.119) between proliferative index and microvessel density
Discussion
In this series it was observed that most of the patients (31.0%) having glial tumors were in the 3rd decade and their mean age was 35.38±17.55 years with age range from 4 to 82 years. Similarly, Chaloob et al.6 and Arshad et al.10 showed the mean age of the glial tumor patients was 35.98 years (age range 2-68 years) and 35 years (age range 5 – 67 years) respectively. Regarding the sex distribution of glial tumors, a number of investigators reported predominance of male. Gender distribution of astrocytoma cases showed slight male preponderance with 53.0% cases compared to female with 47.0% cases obtained by Chaloob et al.6 In another study Arshad et al.10 observed 70.0% and 30.0% were male and female respectively. Similarly, in this study almost three fourths (73.8%) of the patients were male and 26.2% were female. Male female ratio was 2.8:1, which is consistent with the study by Giannini et al.11 study, where they found male 61.6% and female 38.4% with a male to female ratio was 1.6:1.
The most common location of tumor of the patients in the present study was frontal lobe (19.0%) followed by parietal lobe (14.3%), temporal lobe (14.3%) and the temporoparietal and cerebral lobe (9.5%). Chaloob et al found that 33.3% cases were frontal, 31.4% cerebellar, 25.5% parietal and 9.8% temporal lobe.6
In case of WHO grades of glial tumors it was observed in this present series, most 9 (21.4%) patients had anaplastic astrocytoma, (WHO grade III) and glioblastoma multiforme (WHO grade IV) respectively and 6 (14.3%) patient had diffuse fibrillary astrocytoma (WHO grade II) and 4 (9.5%) patient had pilocytic astrocytoma (WHO grade I). Chaloob et al.6 found that 13.2% cases were pilocytic astrocytomas (WHO grade I), 43.1% cases were diffuse fibrillary astrocytomas (WHO grade II), 11.8% cases were anaplastic astrocytomas (WHO grade III) and 31.4% cases were glioblastomas (WHO grade IV), unlike the current study.
The association between cellularity and WHO grades of glial tumor were also assessed in the present study. The mean cellularity was 503.89±130.92 cells/HPF ranging from 208 to 618 cells/HPF in glioblastoma multiforme (WHO grade IV). In anaplastic astrocytoma (WHO grade III), mean cellularity was 385.11±167.27 cells/HPF ranging from 189 to 600 cells/HPF. In ependymoma (WHO grade II), mean cellularity 325.2±102.14 cells/HPF ranging from 200 to 478 cells/HPF and in pilocytic astrocytoma (WHO grade I) 159.5±75.2 cells/HPF ranging from 100 to 268 cells/HPF. In this study there is a trend of little increasing of cellularity with WHO grades and the mean difference of cellularity significantly (p<0.05) differ with different WHO grades. Schiffer et al.12 stated that after multivariate analysis on the histologic parameters, cell density was more significant than number of mitoses. Cell density is categorized as follows: low (<400 cells X high-power field (HPF); medium (400 to 800 cells X HPF); or high (>800 cells nuclei in the most cellular regions of the section. In this study maximum value of cellularity is 648/HPF found in anaplastic ependymoma which is greater than GBM WHO grade-IV. Size of the specimen, representative biopsy and presence or absence of necrosis may affect the cellular density in various grades of glial tumors.
Nuclear pleomorphism alone is considered as an important factor for the recognition of malignancy.13 However, Schiffer et al.12 suggested caution because pleomorphic nuclei can be found in well-differentiated astrocytoma. It was observed in the present study that the association was significant. The current study found four patients had pilocytic astrocytoma, WHO grade I. Among them three (17.6%) had mild and one (10.0%) had moderate nuclear pleomorphism. Nine patients had anaplastic astrocytoma, WHO grade III. Among them one (5.9%) had mild, five (50.0%) had moderate and three (21.4%) had marked nuclear pleomorphism. Nine patients had glioblastoma multiforme WHO grade IV. Among them, two (20.0%) had moderate and seven (50.0%) had marked nuclear pleomorphism (WHO grade I and grade II) are consistent with mild nuclear pleomorphism, (WHO grade III) is regular with moderate and WHO grade IV, with marked nuclear pleomorphism. The association of WHO grades differ significantly (p<0.05) with nuclear pleomorphism.
Regarding the association between mitoses and WHO grades in glial tumors, it was observed in this current study that the mean mitotic count was 8.11±2.76 /10HPF ranging from 5 to 12 /10HPF in glioblastoma multiforme (WHO grade IV), 6.56±2.3 /10HPF with range 4 to 11 /10HPF in anaplastic astrocytoma (WHO grade III), 6.00±2.0 /10HPF ranging from 4 to 8 /10HPF in anaplastic ependymoma (WHO grade III), 6.00±1.41 /10HPF with range 5 to 7 /10HPF in gemistocytic astrocytoma, (WHO grade II), 2.80±1.1 /10HPF ranging from 2 to 4 /10HPF in ependymoma (WHO grade II), 2.50±0.71 /10HPF ranging from 2 to 3 /10HPF in oligoastrocytoma, (WHO grade II), 2.17±0.75 /10HPF ranging from 1 to 3 /10HPF in diffuse fibrillary astrocytoma, (WHO grade II), 2.00±1.41 /10HPF ranging from 1 to 3 /10HPF in oligodendroglioma, (WHO grade II) and 1.67±0.58 /10HPF ranging from 1 to 2 /10HPF in pilocytic astrocytoma (WHO grade I). The above result indicates that there is a linear increase of mitotic count with increasing WHO Grades.
In the present study it was observed that all (100.0%) patients with glioblastoma multiforme (WHO grade IV) had necrosis but no necrosis was found in other WHO grades. The mean difference was statistically significant (p<0.05). According to WHO classification of tumors of the central nervous system, IARC: Lyon 2007, necrosis may be of any type is one of the major histologic features of WHO grade IV glial tumors. Peri necrotic pallisading of tumor cells need not be present. Giannini et al.11 stated that proliferation index was not an independent marker of prognosis when grade IV tumors were considered. The presence of necrosis was a very statistically powerful predictive marker for grade IV tumors. Limited blood supply and hypoxia due to sluggish blood flow and interstitial oedema has been identified as important causes of necrosis.1
Many investigations have demonstrated a significant positive correlation between Ki-67/MIB-1 indices and WHO grades. It was observed in this study that the mean proliferative index was 24.3±8.7% ranging from 15 – 40% in glioblastoma multiforme (WHO grade IV), 25.1±12.4% ranging from 8.8 – 40% in anaplastic astrocytoma (WHO grade III), 18.0±7.6% ranging from 10–25% in anaplastic ependymoma (WHO grade III), 10.8±10.3% ranging from 3.5-18.0 in gemistocytic astrocytoma, (WHO grade II). 4.5±3.7% ranging from 1.0 -10.0% in diffuse fibrillary astrocytoma, (WHO grade II), 3.0 ± 3.1% ranging from 1.0- 8.0 in ependymoma (WHO grade II), 1.6±0.6% ranging from 1.1 -2.0% in oligoastrocytoma, (WHO grade II), 1.0±0.0% in oligodendroglioma, (WHO grade II) and 2.0±0.8% ranging from 1.1 -3.0% in pilocytic astrocytoma (WHO grade-I). There is a linear increase of proliferative index with increasing WHO grades. The mean Proliferative index significantly (p<0.05) differed with different WHO grades. Proliferation marker is helpful in cases where clinical or histopathologic factors are ambiguous. As part of a larger study of proliferation and prognosis, Giannini et al.11 studied the MIB-1 index as an independent prognostic factor in 140 diffuse astrocytomas, including 45 grade II, 50 grade III and 45 grade IV. MIB-1 indices were higher in grade III than in grade II (P = 0.001) and were higher in grade IV than in grade III (P = 0.014). Giannini et al.11 also mentioned that the MIB-1 proliferation index was particularly useful in grade II and III because it identifies aggressive tumors in the grade II category.
The study revealed that MVD by CD34 is significantly different between astrocytomas. MVD is increased with the progression of the pathological grade of astrocytoma. Significant differences of MVD were found among astrocytomas of different grades. Regarding the association between diagnosis and WHO grades with microvessel density it was observed that oligoastrocytoma (WHO grade II) had mean microvessel density 110.5±68.59 ranging from 62 -159, oligodendroglioma, (WHO grade II) 52.0±5.66 ranging from 48 – 56, ependymoma (WHO grade II) 41.0±19.58 ranging from 21 – 72, diffuse fibrillary astrocytoma, (WHO grade II) 32.0±12.01 ranging from 17 – 50, gemistocytic astrocytoma, ( WHO grade II) 32.0±18.38 ranging from 19 – 45, glioblastoma multiforme (WHO grade IV) 100.11±46.62 ranging from 38 – 197, anaplastic astrocytoma, (WHO grade III) 57.13±20.14 ranging from 35 – 87, anaplastic ependymoma (WHO grade III) 51.0±25.94 ranging from 30 – 80, pilocytic astrocytoma (WHO grade I) had mean microvessel density 47.75±19.91 ranging from 26 – 70. The mean microvessel density was higher in WHO grade II and WHO grade IV. The mean microvessel density difference was significantly (p<0.05) differ with different WHO grades.
Spearmen’s positive correlation (r=0.244; p=0.119) was found between proliferative index and microvessel density but not significant (p>0.05). Cavalcante et al.14 stated that association between SPECT-MIB1 and the MVD of low grade astrocytoma, anaplastic astrocytoma and glioblastoma multiforme cases were not significant. But Safy et al.15 showed significant correlation between Ki67 (PI) and CD34 (MVD) which is consistent with my study.
Conclusion
The prognostic utility of proliferative indices among the gliomas (WHO grades I to IV) has been debated and evaluated that the proliferative index is an independent prognostic marker for survival. The determination of a proliferation index is not a routine part of the evaluation of all gliomas, due to limitations associated with tumor heterogeneity and sampling, as well as differences in staining methodology, index determination, and the degree of inter-observer variability. It may be prognostically helpful in histologically borderline cases, such as those that are at the grade II–III and III–IV border. Raised proliferation index indicates a more aggressive neoplasm or tumor progressing to higher grade. Like in this study, six patients out of nine with anaplastic astrocytmas WHO grade-III, had proliferation index >10% indicating progression toward GBM. Among WHO grade II glial tumors in the study, one case of gemistocytic astrocytoma, one case of ependymoma and one case of diffuse fibrillary astroytoma had proliferation index >4% suggesting progress to a higher grade gliomas. Moreover it correlates with the WHO grades. The transition from low-grade to anaplastic astrocytomas or anaplastic astrocytomas to secondary GBM is a dramatic increase in microvascular proliferation. An equivalently robust microvasculature proliferation phenotype is observed also in primary GBM. Vredenburgh et al.16 stated that the combination of anti angiogenesis therapy (bevacizumab) and cytotoxic therapy (irinotecan) is an active regimen for recurrent grade III-IV glioma with acceptable toxicity. Thirty-two patients were assessed (23 with grade IV glioma and 9 with grade III glioma). The median progression-free survival was 23 weeks for all patients. So it can be said that addition of anti-angiogenesis drugs would be beneficial for patients with increased microvessel density in glial tumors. This study may also help the oncologist to select anti angiogenesis therapy along with conventional treatment of glial tumor which show increased MVD. More over, patients of low grade glial tumor with increased proliferative index and microvascular proliferation are at risk of progressing to higher grade tumor. This cases can be detected and predicted as risk group for close monitoring and follow up.
Acknowledgements
The authors acknowledge contribution of
- Shabnam Akhter, Associate Professor, Department of Pathology, in preparing the manuscript
- Tasmina Anam, Medical Officer, Department of Pathology for immunohistochemical staining
References
- Furnari FB, Fenton T, Bachoo RM, Mukasa A, Stommel JM, Stegh A, et al. Malignant astrocytic glioma: genetics, biology, and paths to treatment. Genes & development 2007; 21(21):2683-710.
- Grier JT, Batchelor T. Low-grade gliomas in adults. The Oncologist, 2006; 11(6):681-93.
- Kleihues P, Cavenee WK. Pathology and genetics of tumours of the nervous system. InPathology and genetics of tumours of the nervous system 2000 Lorger M. Tumor microenvironment in the brain. Cancers, 2012; 4(1):218-43.
- Brat DJ, Prayson RA, Ryken TC, Olson JJ. Diagnosis of malignant glioma: role of neuropathology. Journal of neuro-oncology, 2008;89(3):287-311.
- Hsu DW, Louis DN, Efird JT, Hedley-Whyte ET. Use of MIB-1 (Ki-67) immunoreactivity in differentiating grade II and grade III gliomas. Journal of Neuropathology & Experimental Neurology. 1997;56(8):857-65.
- Chaloob MK, Ali HH, Qasim BJ, Mohammed AS. Immunohistochemical expression of Ki-67, PCNA and CD34 in astrocytomas: a clinicopathological study. Oman Medical Journal, 2012;27(5):368-74.
- Leon SP, Folkerth RD, Black PM. Microvessel density is a prognostic indicator for patients with astroglial brain tumors. Cancer, 1996;77(2):362-72.
- Ralte AM, Sharma MC, Karak AK, Mehta VS, Sarkar C. Clinicopathological features, MIB-1 labeling index and apoptotic index in recurrent astrocytic tumors. Pathology & Oncology Research, 2001;7(4):267-78.
- Weidner N, Folkman J, Pozza F, Bevilacqua P, Allred EN, Moore DH, et al. Tumor angiogenesis: a new significant and independent prognostic indicator in early-stage breast carcinoma. CancerSpectrum Knowledge Environment, 1992;84(24):1875-87.
- Arshad H, Ahmad Z, Hasan SH. Gliomas: correlation of histologic grade, Ki67 and p53 expression with patient survival. Asian Pac J Cancer Prev, 2010;11(6):1637-40.
- Giannini C, Scheithauer BW, Burger PC, Christensen MR, Wollan PC, Sebo TJ, et al. Cellular proliferation in pilocytic and diffuse astrocytomas. Journal of Neuropathology & Experimental Neurology, 1999;58(1):46-53.
- Schiffer D, Chiò A, Giordana MT, Leone M, Soffietti R. Prognostic value of histologic factors in adult cerebral astrocytoma. Cancer, 1988;61(7):1386-93.
- Nelson DF, Nelson JS, Davis DR, Chang CH, Pajak TF. Survival and prognosis of patients with astrocytoma with atypical or anaplastic features. Journal of neuro-oncology. 1985;3(2):99-103.
- Pantoja Cavalcante S, De Almeida JR, Clara CA, Scapulatempo Neto C, Verzinhase Peres S, Moriguchi SM, et al. Evaluation of the microvascular density in astrocytomas in adults correlated using SPECT-MIBI. Experimental and Therapeutic Medicine. 2010;1(2):293-9.
- Safy HME, Hamied HEA, Hassan RA, Rezk HM, Ahmed EM, Farag The role of immunohistochemical markers in diagnosis and prognosis of diffuse astrocytoma. Life Science Journal, 2013:12(10): 365-371.
- Vredenburgh JJ, Desjardins A, Herndon JE, Dowell JM, Reardon DA, Quinn JA, et al. Phase II trial of bevacizumab and irinotecan in recurrent malignant glioma. Clinical cancer research. 2007;13(4):1253-9.