Fine Needle Aspiration Cytology in the Diagnosis of Focal Liver Lesions

Fine Needle Aspiration Cytology in the Diagnosis of Focal Liver Lesions

*Saem AM,1 Saha NK,2 Begum F,3 Hye AA,4 Islam N,5 Anam T6

 Abstract

Fine needle aspiration cytology (FNAC) assisted by cell block examination might be more accurate method for the definitive diagnosis of focal liver lesions (FLL). This study was designed to find out the role of FNAC in the diagnosis of FLLs in comparison to cell block preparations. This cross sectional observational study was carried out in the department of Pathology in collaboration with the department of Radiology & Imaging at Sylhet MAG Osmani Medical College. Study period was from 1 July, 2015 to 30 June, 2016. Clinically & radiologically diagnosed patients of focal liver lesions were study populations. The age of the study patients ranged from 15 to 80 years with a mean of 53.58 years. On FNAC, 10% cases were unsatisfactory, 8% cases were cystic lesion, 4% cases were benign tumor and 78% cases were malignant tumor. Among 39 malignant cases, 30.77% cases were hepatocellular carcinoma (HCC) and 69.23% cases were metastatic adenocarcinoma. Unsatisfactory samples were 18.18%, 6.82% were benign tumors and 75% were malignant tumors. Among the malignant lesions, 18.18% were HCC and 81.82% were metastatic adenocarcinoma. The sensitivity, specificity, positive predictive value (PPV), negative predictive value(NPV) and accuracy of FNAC in the evaluation of FLLs were 100%, 66.67%, 97.06%, 100% and 97.22%, respectively. The sensitivity, specificity, PPV, NPV and accuracy of FNAC in the detection of HCC were 66.67%, 85.18%, 50%, 92% and 81.82% respectively. FNAC of focal liver lesions has high sensitivity and accuracy in the detection of malignancy but it has low sensitivity in the detection of HCC. Cell block preparations were found superior to cytomorphology as immunostaining can be done on cell block preparations.

[Journal of Histopathology and Cytopathology, 2017 Jul; 1 (2):110-115]

 Key words: Focal liver lesions, FNAC, Cell block, Immunohistochemistry, HCC, and Metastatic carcinoma.

  1. *Dr. Abu Mohammad Saem, Lecturer, Department of Pathology, Comilla Medical College, Comilla. saemshampa@yahoo.com
  2. Naba Kumar Saha, Professor & Head, Department of Pathology, MAG Osmani Medical College, Sylhet.
  3. Ferdousy Begum, Associate Professor, Department of Pathology, Bangabandhu Sheikh Mujib Medical University, Dhaka.
  4. Azizul Qadar Md. Abdul Hye, Associate Professor Department of Pathology, MAG Osmani Medical College, Sylhet.
  5. Nazmul Islam, Assistant Professor, Department of Pathology, Army Medical College, Comilla.
  6. Tasmina Anam, Scientific Officer, Department of Pathology, Bangabandhu Sheikh Mujib Medical University, Dhaka.

 * For correspondence

 Introduction

A focal liver lesion (FLL) is a solid or cystic mass or area of tissue that is identified by radiological or imaging techniques as an abnormal part of the liver. It may be either a benign lesion such as focal nodular hyperplasia, hepatocellular adenoma and hepatic cyst or a malignant lesion such as hepatocellular carcinoma, cholangiocarcinoma, hepatoblastoma and metastatic carcinoma.1

Pathological examination is an important aspect in the evaluation of an FLL. FNAC is the preferred method for diagnosis of focal liver lesions and needle core biopsy (NCB) for evaluating diffuse liver diseases where architectural details are important.2 In recent years FNAC has emerged as an effective tool for diagnosis of a hepatic mass.


Cell blocks prepared from residual materials of fine needle aspirations can be useful adjuncts to smears for establishing a more definitive cytopathological diagnosis.3 Use of cell blocks improves diagnostic accuracy as it facilitates study of architecture details of multiple sections, use of special stains and immunohistochemistry.4

The distinction of moderately to poorly differentiated hepatocellular carcinoma from metastatic carcinoma may be a major problem for cytologists and this distinction is clinically important. Immunohistochemistry is required in this situation to differentiate hepatocellular carcinoma from metastatic carcinoma.5

With this background the study was designed to find out the role of FNAC in the diagnosis of focal liver lesions and to correlate its efficacy with cell block preparations using H&E and immunohistochemistry.

Methods

This cross sectional observational study was carried out in the department of Pathology in collaboration with the department of Radiology & Imaging at Sylhet MAG Osmani Medical College from 1 July, 2015 to 30 June, 2016. Clinically and radiologically diagnosed patients of focal liver lesions attending the department of Radiology & Imaging from different departments during the study period were the target population and those who fulfilled the inclusion and exclusion criteria were considered as study population. Patients of all ages and both sexes were included. Patients with bleeding diathesis, suspected liver abscess, hydatid cyst and hemangioma were excluded from the study. 22 gauge needle was placed in the lesion under ultrasound guidance and the material was aspirated with a 10 ml disposable syringe. After placing aspirates on the slides, thin smears were prepared by gentle friction of two slides. Then smears were fixed in 95% ethyl alcohol for at least 30 minutes and stained with Papanicolaou stain. After preparation of smears, the residual material was secured for clot preparation. It was then transferred into 10% formalin and processed as a cell block.6 Then, the cell blocks were cut at 5 micrometer thickness and were stained with Harri’s Haematoxylin and Eosin stain. From the paraffin block 3 micrometer sections were cut and stained for immunohistochemistry with Glypican-3 antibody. The immunohistochemistry was performed in the Immunohistochemistry Laboratory of Bangabandhu Sheikh Mujib Medical University (BSMMU) following their staining protocol. All the data were organized by using scientific calculator and Statistical Package for Social Science (SPSS) version 23.

 Results

The age of the study patients ranged from 15 to 80 years with a mean of 53.58 years (SD +15.32). Out of 50 cases, 33 (66%) were male and 17 (34%) were female with male to female ratio of 1.94:1. Among these patients, the highest number of patients 13(26%) were in the age group 51-60 years (Table I).

Table I: Age and sex distribution of study cases (n=50)


Age Groups (years) Male
No (%)
Female

No (%)

Total

No (%)

11-20 2(4) 1(2) 3(6)
21-30 1(2) 0(0) 1(2)
31-40 2(4) 4(8) 6(12)
41-50 9(18) 3(6) 12(24)
51-60 7(14) 6(12) 13(26)
61-70 10(20) 2(4) 12(24)
71-80 2(4) 1(2) 3(6)
Total 33(66) 17(34) 50(100)


Out of 50 focal liver lesions, 5 cases were unsatisfactory, 4 cases were cystic lesion, 2 cases were benign tumor and 39 cases were malignant tumor in cytology. Among the malignant cases, 12 were hepatocellular carcinoma (HCC) and 27 were metastatic adenocarcinoma (Figure 1).
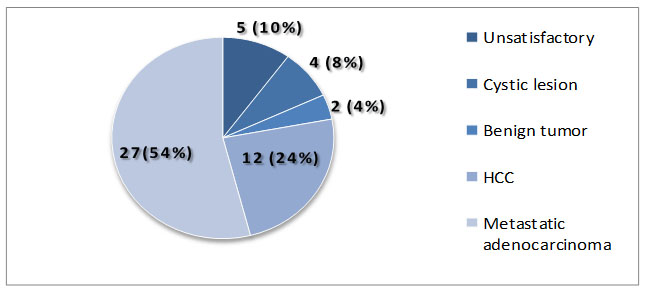
 Figure 1. Pie diagram showing distribution of study cases according to FNA cytomorphology

Finally, 8 unsatisfactory, 3 benign and 33 malignant cases were diagnosed in cell block preparations. Among 33 malignant cases 6 were diagnosed as hepatocellular carcinoma (HCC) and 27 were diagnosed as metastatic adenocarcinoma (Figure-2).
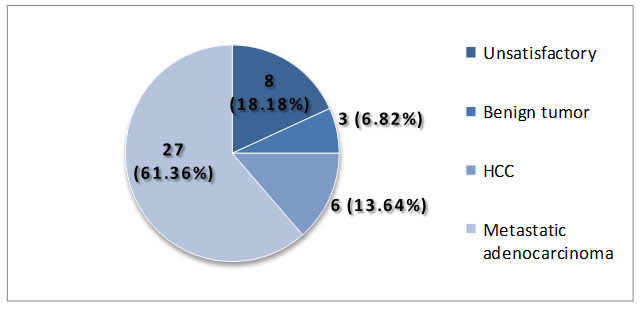
 Figure 2. Pie diagram showing distribution of 44 cases according to combined cell block preparations.

 36 cases were conclusive on both cytomorphology and cell block preparations. On evaluation of cytomorphological diagnosis of 36 cases, 33 were true positive diagnosis, 2 were true negative diagnosis, 1 was false positive diagnosis and there was no false negative diagnosis (Table II). Sensitivity, specificity, PPV, NPV and accuracy of FNAC in the diagnosis of malignant focal liver lesions were100%, 66.67%, 97.06 %, 100 % & 97.22 %, respectively.

Table II: Statistical evaluation of cytomorphological diagnosis of 36 conclusive cases.


Combined cell block preparations (H&E and IHC) Cytomorphological diagnosis
Disease positive (Malignant) Disease negative(Benign)
Positive(Malignant)   33 TP               33 FP                  1
Negative(Benign)       3 FN                0 TN                  2
Total                         36                    33                        3


TP= True positive, TN= True negative, FP= False positive, FN= False negative

33 cases were diagnosed as malignant by both FNAC and cell block preparations. On evaluation of cytomorphological diagnosis, 4 were true positive, 23 were true negative, 4 were false positive and 2 were false negative in the detection of HCC (Table III). Sensitivity, specificity, PPV, NPV and accuracyof FNAC in the detection of HCC were 66.67%, 85.18%, 50%, 92% and 81.82%, respectively.

Table III: Statistical evaluation of cytomorphological diagnosis in the detection of HCC.


Combined cell block preparations (H&E and IHC) Cytomorphological diagnosis
Disease positive (HCC) Disease negative

(Non HCC)

Positive (HCC)                   6 TP               4 FP                   4
Negative (Non HCC)        27 FN               2 TN                  23
Total                                 33                     6                        27


TP= True positive, TN= True negative, FP= False positive, FN= False negative

Discussion

In the present study, USG guided FNAC was compared with cell block preparations (H&E and immunohistochemistry) in differentiation of focal liver lesions. FNA smears were available in all the 50 cases, but cell blocks were available in 44 cases.

Age of the study patients ranged from 15 to 80 years with a mean of 53.58 years. Nazir et al. (2010) and Kuo et al. (2004) showed 55 and 58.1 years as mean age in their studies which are close to the mean age of present study.7,8 Highest number of patients (26%) was in the age group of 51-60 years in our study. Nazir et al. (2010) reported that maximum number of cases was seen between 55-65 years of age which is nearly similar to present study.7 Out of 50 cases, 33 (66%) were male and 17 (34%) were female with male to female ratio of 1.94:1. Similar findings were reported by Swamy et al. (2011).9 Nazir et al. (2010) showed a male to female ratio of 1.7:1 which is also close to present study.7

Out of 50 cases, 5 (10%) cases were unsatisfactory, 4 (8%) cases were cystic lesion, 2 (4%) cases were benign tumor and 39 (78%) cases were malignant tumor on cytomorphology. Further categorization of benign tumors was not done as in Khurana et al. (2009).6 Among 39 malignant cases, 12 (30.77%) cases were HCC and 27 (69.23%) cases were metastatic carcinoma. All the cases of metastatic carcinoma were adenocarcinomas. Nearly similar findings were found on cytomorphology in the study of Mohmmed et al. (2012), Nazir et al. (2010), Khurana et al. (2009) and Ceyhan et al. (2006).6,7,10,11 Ozkara et al. (2012) found 9.9% of cases as unsatisfactory on cytomorphology which is similar to the unsatisfactory smear (10%) of the present study.12

In final diagnosis of 44 cases by combined cell block preparations (H&E and immunohistochemistry), 8 (18.18%) were unsatisfactory, 3 (6.82%) were benign tumors and 33 (75%) were malignant tumors. Nazir et al. (2010) reported 85% cases as malignant which is nearly close to the malignant cases found in the present study.7 But Mohmmed et al. (2012) showed 39% cases as malignant which is lower and Khurana et al. (2009) showed 93.75% cases as malignant which is higher than that of present study.6,10 Among the malignant lesions, 6 (18.18%) were HCC and 27 (81.82%) were metastatic adenocarcinoma in our study. Khurana et al. (2009) found 17.78% cases as HCC and 82.22% cases as metastatic tumor which are concordant with the present study.6

The sensitivity, specificity, and accuracy of USG guided FNAC in the evaluation of focal liver lesions were 100%, 66.67% and 97.22%, respectively. Sensitivity of the present study (100%) is similar or close to the sensitivity of studies done by Khurana et al. (2009), Nazir et al. (2010), Swamy et al. (2011) and Mohmmed et al. (2012).6,7,9,10 Specificity of the present study (66.67%) has concordance with the specificity found by Mohmmed et al. (2012).10 The specificity shown by Khurana et al. (2009), Nazir et al. (2010) and Swamy et al. (2011) has discordance with that of current study.6,7,9The present study showed an accuracy of 97.22% which is similar to that of Nazir et al. (2010) and Swamy et al. (2011).7,9

The sensitivity, specificity, and accuracy of FNAC in the detection of HCC were 66.67%, 85.18% and 81.82% respectively in our study.  Sensitivity of FNAC in the detection of HCC described by Ozkara et al. (2013) was 68.2% which is similar to the sensitivity of present study.12 Khurana et al. (2009) and Nazir et al. (2010) showed the sensitivity in the detection of HCC as 72.3% and 96% respectively which are higher than the sensitivity of present study.6,7 Specificity and accuracy showed by Nazir et al. (2010) were 100% and 97.5% respectively which are also higher than those of the present study.7

 Conclusion

FNAC of focal liver lesions has high sensitivity and accuracy in the detection of malignancy but it has low sensitivity in the detection of HCC. No significant complication was observed during aspiration. FNAC is a relatively safe, quick, cost effective and patient compliant procedure which has high accuracy in the differentiation between benign and malignant focal liver lesions. Simultaneous cell block preparations can improve the efficacy of FNAC in the subtyping of malignancy.

 References

  1. Marrero JA, Ahn J, Reddy KR. ACG clinical guideline: The Diagnosis and Management of Focal Liver Lesions. Am J Gastroenterol, 2014; 109(9): 1328-47.
  2. Conrad R, Prabhu SC, Cobb C, Raza A. Cytopathologic diagnosis of liver mass lesions. J Gastrointest Oncol, 2013; 4(1): 53-61.
  3. Nathan NA, Narayan E, Smith MM, Horn MJ. Cell block cytology: Improved Preparation and its Efficacy in Diagnostic Cytology. Am J Clin Pathol, 2000; 114: 599-606.
  4. Ali SR, Jayabackthan L, Rahim S, Sharel MB, Prasad K, Hegdekatte N. Role of fine needle aspiration cytology in the diagnosis of hepatic lesions. Muller J Med Sci Res, 2015; 6(2): 125-128.
  5. Ahuja A, Gupta N, Srinivasan R, Kalra N, Chawla Y, Rajwanshi A. Differentiation of Hepatocellular Carcinoma from Metastatic Carcinoma of the liver – Clinical and Cytological features. J Cytol, 2007; 24(3): 125-129.
  6. Khurana U, Handa U, Mohan H, Sachdev A. Evaluation of Aspiration Cytology of the Liver Space Occupying Lesions by Simultaneous Examination of Smears and Cell Blocks. Diagn Cytopathol, 2009; 37(8): 557-563.
  7. Nazir RT, Sharif MA, Iqbal M, Amin MS.Diagnostic Accuracy of Fine Needle Aspiration Cytology in Hepatic Tumours. J Coll Physicians Surg Pak, 2010; 20(6): 373-376.
  8. Kuo FY, Chen WJ, Lu SN, Wang JH, Eng HL. Fine Needle Aspiration Cytodiagnosis of Liver Tumors. Acta Cytologica, 2004; 48(2): 142-148.
  9. Swamy MCM, Arathi CA, Kodandaswamy CR. Value of ultrasonography-guided fine needle aspiration cytology in the investigative sequence of hepatic lesions with an emphasis on hepatocellular carcinoma. J Cytol, 2011; 28(4): 178-184.
  10. Mohmmed AA, Elsiddig S, Abdullhamid M, Gasim GI, Adam I. Ultrasound- guided fine needle aspiration cytology and cell block in the diagnosis of focal liver lesions at Khartoum Hospital, Sudan. Sudan JMS, 2012; 7(3): 183-187.
  11. Ceyhan K, Kupana SA, Bektas M et al. The diagnostic value of on-site cytopathological evaluation and cell block preparation in fine-needle aspiration cytology of liver masses. Cytopathol, 2006; 17: 267–274.
  12. Ӧzkara SK, Tuneli IӦ. Fine Needle Aspiration Cytopathology of Liver Masses: 101 cases with Cyto-/Histopathological Analysis. Acta Cytologica, 2013; 57:332-336


Comparing PAP Smear Cytology with High Risk Human Papilloma Virus DNA Test in Patients of Cervical Lesions

Comparing PAP Smear Cytology with High Risk Human Papilloma Virus DNA Test in Patients of Cervical Lesions

*Ansari NP,1  Rahman AN,2  Saleh AM,3 Shahida SM4

 Abstract

Cervical cancer is the second most frequent type of cancer worldwide. More than eighty eight percent deaths from cervical cancer occur in developing countries. In developed countries, the cases and deaths have declined markedly due to their extensive screening programs. The present study was undertaken to assess precancerous and cancerous cervical lesions by cytology as well as Human Papilloma virus (HPV) DNA identification and their comparison with histopathology in Visual Inspection of Cervix with Acetic Acid (VIA) positive cases. This observational study was carried out at the Department of Pathology in collaboration with the Department of Gynaecology and Obstetrics of Mymensingh Medical College Hospital and Department of Microbiology and Hygiene of Bangladesh Agriculture University for HPV DNA detection during the period of July 2012 to June 2013. Study was carried out among 160 VIA positive patients and selected by non-random judgment sampling from the colposcopy clinic. Out of 160 cases, only 40(25.00%) were found HPV DNA positive, while the rest 120(75.00%) cases were negative. Among positive cases 77.50% were cancerous cases and 22.50% were precancerous cases. It was further revealed that in cancerous cases, 86.11% were HPV DNA positive. PCR showed low sensitivity, probably due to sampling error and inclusion of all cases (chronic cervicitis, precancerous and cancerous lesion). The statistical value of accuracy, sensitivity and specificity of Pap smear cytology, HPV DNA test and histopathology yielded some important directives. The sensitivity values of Pap smear cytology and HPV DNA were found 87.50% and 88.89% respectively.  Thus Pap smear test showed almost equal sensitivity to DNA test. The accuracy of the Pap smears and HPV DNA in this study was 88.13% and 96.88% respectively. The accuracy of Pap smears is lower than HPV DNA tests. The present study showed the significant relationship between cytological with HPV DNA test and histopathological diagnosis. But cytology and HPV DNA testing are not suitable as a single test. In conclusion, it can be stated that combination cytology (Pap smear), histopathology and new technologies such as HPV DNA typing would ultimately be more useful.

[Journal of Histopathology and Cytopathology, 2017 Jul; 1 (2):102-109]

 Key words: Pap smear cytology, Human Papilloma virus, Cervical lesions

  1. *Dr. Nazma Parvin Ansari, Assistant Professor of Pathology, Community Based Medical College, Mymensingh. palashansaripath@gmail.com
  2. AJE Nahar Rahman, Honorary Professor, Department of Pathology, BIRDEM, Dhaka.
  3. AFM Saleh, Professor of Pathology, Mymensingh Medical College, Mymensingh.
  4. S M Shahida, Assistant Professor of Gynae & Obs, Dhaka Medical College, Dhaka

 *For correspondence

Introduction

Cervical cancer is the second most frequent type of cancer and the leading cause of mortality among women worldwide.1 According to WHO/ICO Report2 the   incidence rates of cervical cancer in Bangladesh are highest compared to other countries of South Asia and the annual mortality is 11.6 per 1,00,000 women. The report further stated that 50.19 million women are at risk of developing cancer. Each year 17,686 women are diagnosed with cervical cancer and 10,364 die from the disease. It is observed that the cases and deaths have declined markedly in developed countries from approximately 1.4 to 1.7 per 1,00,000 women and this reduction was mainly as a result of extensive screening programs.3,4

 There is worldwide agreement that screening test for cervical cancer is a necessity because it separates healthy persons from those with a high probability of having the disease. The lower incidence in developed countries is due to the access of women to screening test, which allows precancerous lesions to be detected and treated before they develop into full blown cancer.5 Popular screening tests are Papanicolaou (PAP) smear, visual inspection of cervix with acetic acid (VIA) and HPV DNA test. The uptake of screening test in many developing countries is still poor.6,7,8,9  VIA has been introduced by the Government of Bangladesh to screen mass population because it is easy procedure and cost effective. All the government medical college hospitals, district hospitals, maternal and child welfare centers and some of the urban primary health care centers have facilities for VIA test free of cost by the support of UNFPA Bangladesh. Bangabandhu Sheikh Mujib Medical University (BSMMU) is collaborating with Government of Bangladesh in expansion of these facilities.10

At the present time a good deal of attention is being paid to screening for early confirmatory detection of cancer. The present study was undertaken to assess precancerous and cancerous cervical lesion by cytology in VIA positive cases and the relationship between the high risk Human Papilloma viruses.

 Methods

This was a descriptive, cross-sectional type of observational study. The study was carried out in the Department of Pathology, Mymensingh Medical College. Patients of different age groups were selected from colposcopy clinic of Mymensingh Medical College Hospital. Duration of study was one year ranging from July 2012 to June 2013. A total of 160  patients were selected in the mentioned study period with follwing criteria which were (1) VIA positive married married females aged 30-60 years and (ii) who were married for at least 10 years but below 30 years of age. The study excluded patients who were pregnant, below twenty years of age and patient at menstruating period.  PAP smears were collected with Ayer’s spetula and cytobrash by gynaecologists in the colposcopy clinic in the department of Mymensingh Medical College Hospital. Colposcopy guided punch biopsy were taken by same gynecologists from the suspected lesions of the VIA positive cases. Histopathological examination of the biopsy samples were done in the department of Pathology, Mymensingh Medical College. HPV DNA detection by Polymerase Chain Reaction was done from paraffin embedded tissue blocks. HPV type 16, 18, 31 and 52 primers were used.

Results

The study was undertaken to assess the precancerous and cancerous cervical lesion by cytology in VIA positive cases and compare their results with histopathology and high risk Human Papilloma Virus (hr-HPV) DNA test. Table I shows that 36 (22.50%) patients were in 20 to 29 years age group, 72 (45.00%) patients belonged to the age group 30 to 39 years, 37 (23.10%) cases in 40 to 49 years age group and 15 (9.40%)  cases in 50-59 years group.

Table I: Age distribution of the subjects

Age Groups in Year Frequency %
20-29 36 22.5
30-39 72 45
40-49 37 23
50-59 15 9.4
Total 160 100

*Mean () = 38.00 Years; Standard Deviation (SD) = 8.15 Years.

Table II shows the results of Pap smears diagnosis. On cytological examination, 63 (39.40%) cases were diagnosed as Negative for Intraepithelial Lesion or Malignancy (NILM), followed by 5 (3.10%)  cases diagnosed as lesions with  Atypical Squamous Cells of Undetermined Significance (ASCUS) and  other 5 (3.10%) cases were found Atypical Squamous Cell  that cannot exclude HSIL (ASC- H), 40 (25.00%)  patients with Low Grade Squamous Intraepithelial Lesions (LSIL); 17 (10.60%) patients with high grade squamous intraepithelial lesion (HSIL)and 30 (18.75%)  patients  were diagnosed as Squamous Cell carcinoma (SCC).

Table II: Cytological (Pap smear) diagnosis of cervical lesions

Serial no. Pap smear test

result

Frequency %
1 NILM 63 39.40
2 ASCUS 05 3.10
3 ASC-H 05 3.10
4 LSIL 40 25.00
5 HSIL 17 10.60
6 Squamous Cell Carcinoma 30 18.75
Total 160        100.00

NILM = Negative for Intraepithelial Lesion or Malignancy, ASCUS = Atypical Squamous cells with Undetermined Significance, LSIL = Lowgrade Squamous Intraepithelial Lesion, HSIL = High grade Squamous Intraepithelial Lesion, ASC-H = Atypical Squamous Cell  that cannot exclude HSIL

The histopathological result of 160 cases is presented in Table III. It was revealed that 56 (35.0%) cases had chronic cervicitis, 51 (31.9%) cases  mild dysplasia (CIN-I), 14 (8.8%)  cases diagnosed as  moderate dysplasia (CIN II), 3 (1.9%) patients were severe dysplasia / CIN III and the remaining 36 (22.5%)  cases show invasive squamous cell carcinoma (SCC).

 Table III: Histological diagnosis of patients with cervical lesions

SL. no. Histological

Diagnosis

 Frequency %


1 Chronic Cervicitis 56 35.00
2 CIN – I 51 31.90
3 CIN II 14 8.80
4 CIN III  3 1.90
5 Squamous cell carcinoma 36 22.50
Total 160 100


CIN = Cervical Intraepithelial Neoplasia

Table IV shows that on histological examination of 160 cases, a total of 56 (35.00%) cases were found with chronic cervicitis, among them 50 (79.37%) cases were correctly diagnosed previously cytologically as negative for intraepithelial lesion. Out of 51 (31.9%) diagnosed CIN I cases, 34 (85.0%) cases were diagnosed  cytologically as LSIL. Out of 14  (8.8%) cases diagnosed as CIN II, 10 (58.82%) cases were diagnosed cytologically HSIL. Out of 3 (1.90%) cases of histologically diagnosed  CIN III, 2 (11.76%) cases were diagnosed cytologically as HSIL. The 30 cases were diagnosed cytologically as carcinoma and those cases were histologically confirmed as squamous cell carcinoma. There is highly significant relationship in respect to cytological (PAP smear) and histological diagnoses of cervical lesions in the study group (P<0.005).

Table IV: Comparison of Cytological (PAP smear) and histological diagnoses of cervical lesions


Frequency in PAP  smear diagnosis Frequency in histological diagnosis
Pap smear

Test

Frequency Chronic Cervicitis CIN I CIN II CIN III Squamous cell carcinoma
NILM 63 50(79.37) 13(20.63) 00 00 00
ASCUS 05 00 3(60.00) 2(40.00) 00 00
ASCH 05 00 00 2 (40.00) 1(20.00) 2 (40.00)
LSIL 40 6 (15.00) 34 (85.00) 00 00 00
HSIL 17 00 1 (5.89) 10 (58.82) 2 (11.76) 4 (23.52)
Squamous cell carcinoma 30 00 00 00 00 30 (100.00)
Total 160 56 51 14 03 36

NILM = Negative for Intraepithelial Lesion or Malignancy, ASCUS = Atypical Squamous cells with Undetermined Significance, LSIL = Lowgrade Squamous Intraepithelial Lesion, HSIL = High grade Squamous Intraepithelial Lesion, ASC-H = Atypical Squamous Cell  that cannot exclude HSIL

*Figures within parentheses indicate percentage

 The HPV DNA test of cervical lesions was conducted on all 160 cases. The result is shown table V. Out of 160 cases, only 40 (25%) cases were positive and the rest 120 (75%) cases were negative for HPV DNA.

Table V: Diagnosis of cervical Lesions by HPV DNA test (PCR)

HPV DNA test Frequency %
Positive 40 25
Negative 120 75
Total 160 100

Table VI gives a correspondence result of Histological Diagnosis with Pap smear and HPV DNA test. It was remarkable that out of 36 squamous cell carcinoma cases 31 patients were detected by HPV DNA test. The result further indicates that the cytological diagnosis nearer to the histological findings in almost all cases under this study and in case of high grade lesion and carcinoma it was almost close to positive reaction to HPV DNA test.

Table VI. Correspondence of histological diagnosis with PAP smear and HPV DNA test


Histological

diagnosis

Frequency Frequency of Pap Smear diagnosis N0. of patients

positive to HPV DNA test

NILM ASCUS ASCH LSIL HSIL Squamous cell carcinoma Positive Negative
Chronic

cervicitis

56 50 06 00  56
CIN – I 51 33 03 00 34 01 00 02  49
CIN – II 14 02 02 10 05  09
CIN – III 03 00 01 00 02 02  01
Squamous cell carcinoma


36 02 04 30 31  05
Total 160 63 05 05 40 17 30 40 120


NILM = Negative for Intraepithelial Lesion or Malignancy, ASCUS = Atypical Squamous cells with Undetermined Significance, LSIL = Lowgrade Squamous Intraepithelial Lesion, HSIL = High grade Squamous Intraepithelial Lesion, ASC-H = Atypical Squamous Cell  that cannot exclude HSIL

The result illustrates that the sensitivity value of this test is almost equal to both Pap test and HPV DNA test, those were found 87.50% and 88.89% respectively. In case of specificity value the Pap test yielded 89.29% and HPV DNA tests yielded higher value, 100%.

Table   VII: Comparison of statistical analysis of PAP smear and HPV DNA test


Statistical value Pap smear

Cytology in %

HPV DNA test in %
Sensitivity 87.50   88.89
Specificity 89.29 100.00
Accuracy 88.13   96.88
Predictive value of a

positive test

93.81 100.00


Predictive value of a

negative test

79.37  95.83

 HPV DNA revealed that, HPV – 16 were present in the highest percent (75%), HPV-18 were in 15% and the lowest number of occurrences were HPV – 31 type in 5% and HPV – 52 type in 5 %.

 Discussion

The present study focused on traditional Pap smear method and HPV DNA type identification for cervical screening and their comparison with colposcopic biopsy. In this study, 160 VIA positive women were selected. Pap smear cytology, histopathological examination and HPV DNA test were done in every cases. On cytological (Pap Smears) examination it was revealed  that 63 (39.4%) cases were diagnosed as Negative for Intraepithelial Lesion or malignancy (NILM), 5 (3.10%) cases were diagnosed as Atypical Squamous Cell of Undetermined Significance (ASCUS) and 5 (3.10%)  cases were Atypical Squamous Cell  cannot exclude HSIL (ASC- H), 40 (25%)  patients with Low Grade Squamous Intraepithelial Lesions (LSIL); 17 (10.6%) patients with high grade squamous intraepithelial lesion (HSIL) and 30 (18.75%) cases were diagnosed as Squamous Cell carcinoma (SCC). A study on patients attending the OPD of BSMMU showed much lower incidence in Pap smear. The percentages of SCC, LSIL and NILM were 0.2%, 4.20% and 91.70% respectively. The lower incidence may be due to incorporation of normal cases in BSMMU study.11

The result of histopathological examinations of 160 cases revealed 56 (35%)  cases of chronic cervicitis, 51 (31.9%) cases of mild dysplasia (CIN-I), 14 (8.8%)  cases of moderate dysplasia (CIN II), 3 (1.9%) patients of severe dysplasia (CIN III) and the remaining 36(22.5%)  cases as invasive squamous cell carcinoma (SCC). Among cytologically diagnosed 30 (18.75%) squamous cell carcinoma cases all were confirmed histologically as squamous cell carcinoma. Highly significant relationship was found with cytological (Pap smear) and histological diagnoses of cervical lesions in this study group (p<0.005).

A study was performed in BSMMU on 70 histologically diagnosed cases of CIN. Out of 70 cases, 34 (48.6%) cases were CIN-I and 36 (50.4%) cases were CIN-II/III.12  Another study  from Brazil reported the percentage of CIN-I, CIN-II and squamous cell carcinoma to be 12.0%, 4.3% and 1.0% respectively13. The higher percentage of the present study reflects the inclusion of VIA positive cases only. In Bangladesh a cross sectional study was found and the above occurrences as 21.4%, 10.0% and 29.0% respectively.14

Therefore, out of 160 cases 91(56.88%) cases were correctly diagnosed by cytology, 13 (8.13%) cases were false negative, 6 (3.75%) cases were false positive and 50 (31.25) cases were negative for precancerous and cancerous lesions. There is a significant correlation between Pap smear and Histological findings. Others studies similarly found a significant concordance between Pap smear and histological tests for the diagnosis of precancerous cervical lesions.15,14,16

The result of the HPV DNA detection conducted on all 160 cases. Out of 160 cases, only 40 (25.00 %) were found positive and the rest 120 (75.00%) cases were negative. Present study shows that 86.11% positive in cancerous lesions. The technology can find the HPV DNA in almost 100.0% of the invasive cervical cancer cases, 75.00-100.00% of precancerous lesions and 50.00% of borderline lesions’ samples.17,18

.Comparison between HPV DNA test and Pap smear diagnosis represents none of the NILM and ASCUS positive cases exhibited positive reaction to PCR. Among 5(3.10%) ASCH cases 02(40.0%) were PCR positive. Out of 40(25.0%) LSIL cases only 2(5.00%) cases were detected positive. The detection of HSIL cases were found to 11(64.7%) cases out of 17(10.6%) cases. The Squamous cell carcinoma patient’s show out of 30(18.75%) cases 25 (83.33%) cases were positively detected by PCR. The present study indicated that Pap smear cytology is still better than only HPV DNA test for the diagnosis of chronic cervicitis, LSIL, HSIL.

However, a study, comparing the histological diagnosis and it was revealed that none of the chronic cervicitis cases exhibit positive for PCR test.19 Present study also revealed that none of the chronic cervicitis cases show positivity to PCR detection.

 The present study has shown that the occurrence of different types of HPV virus be responsible for the causation of cervical cancer. These are detected in samples of patients of cervical lesions. HPV DNA revealed that, HPV – 16 were present in the highest percent (75.00%), HPV-18 were 15.00% and the lowest number of occurrences were HPV – 31 type 5.00 % and HPV – 52 type 5.00 %.

The accuracy of the Pap smears and HPV DNA in this study show to 88.13% and 96.88% respectively. This demonstrates that the accuracy of Pap smears is lower in respect to HPV DNA tests. The accuracy thus determines that the probability of correct diagnosis could be detected by the later tests singly or combined.  Specificity  in case of Pap smear test is 89.29 and in case case of HPV DNA 100.0%. This means that specificity is higher in DNA test. The sensitivity values of Pap smear cytology and HPV DNA were found 87.5% and 88.89%   respectively. The sensitivity value focuses on the ability of a test to correctly diagnose the disease. In this case the cytological diagnostic test is almost equal to DNA test.

 Conclusion

It can be concluded that HPV DNA test is not suitable as a single test for detecting precancerous and cancerous lesion than routine Pap smear test. All the cytologically diagnosed NILM (negative for intraepithelial lesion or malignancy) cases and all histologically diagnosed chronic cervicitis cases were HPV DNA test negative. So, mass screening programme does not need HPV DNA test. This will reduce the cost of the screening programme. Combination of cytology (Pap smear) and new technologies such as HPV DNA test would ultimately be more useful. Based on findings, the study recommended that, PAP test should be routinely used in every patient attending the colposcopy clinic, biopsy should be taken in all VIA positive patient and combined pap test and histopathological examination is enough to detect cervical precancerous and cancerous lesion. In our country HPV DNA test is not mandatory as a routine test.

 References

  1. Parkin DM. The global burden of infection-associated cancers in the year 2002. Int. J. Cancer, 2006; 118:3030-44.
  2. WHO/ICO Information Centre on HPV and Cervical Cancer (HPV Information Centre), 2010. Human Papilloma virus and related cancers in Bangladesh. Summary Report [accessed: 10-03-2013]; available at www.who.int/hpvcentre.
  3. Carter JR, Ding Z and Rose BR. 2011 HPV infection and cervical disease: A review. Australian and New Zealand Journal of Obstetrics and Gynaecology, 51: 103- 108.
  4. Tomljenovic L, Shaw CA, Spinosa JP. Human Papillomavirus (HPV), Vaccines as an option for Preventing cervical malignancies; How effective and safe? Current Pharmacological Design, 2013; 19:1-2.
  5. Crum PC. The Female Genital Tract’ in Robbins and Cotran Pathologic Basis of Diseases. 7th edition Kumar V, Abbas AK and Fausto N (eds) Elsevier Saunders, Philadelphia, 2004; Pp1049-1053.
  6. Goldie SJ, Kuhn L Denny L, Pollack A, Wright TC. Policy Analysis of Cervical Cancer Screening Strategies in Low-Resource Settings: Clinical Benefits and Cost-effectiveness. JAMA 2001; 285:3107-15.
  7. ACCP (Alliance for Cervical Cancer Prevention) 2004. Planning and implementing cervical cancer prevention and control programs. A manual for managers. ACCP, Seattle.
  8. Ngoma T, 2006. World Health Organization cancer priorities in developing countries. Ann. Oncol. 17, Suppl 8, viii9-viii14.
  9. Sangwa-Lugoma G, Mahmud S, Nasr SH, Liars J, Kayembe PK, Tozin RR, Drouin P, Lorincz A, Ferenczy A, Franco EL. Visual inspection as a cervical cancer screening method in a primary health care setting in Africa. Int. J. Cancer, 2006; 119:1389-95.
  10. Tahera A, Ashrafunnessa, Jebunnessa R. Development of a visual inspection programme for cervical cancer prevention in Bangladesh. Reproductive Health Matters. 2008; 16(32):78-85.
  11. Ashrafunnesa, Khatun S, Shamsuddin L, Rahman AJ, Kamal, Kabir S etal. Cervical dysplasia among the women attending gynaecological outpatient department of a teaching hospital. Bangladesh Journal of Medical Science, 2002; 8(1):39-41.
  12. Ashrafunnesa, Khatun S, Haq F, Islam MN, Hossain MS, Aziz MM et al. 2006.Human Papilloma virus in cervical cancer in Bangladesh. Bangladesh J Obster Gynecol, 2006; 21(2):51-57.
  13. Syrjänen K, Naud P, Derchain S, Roteli-Martins C, Longatto-Filho A, Tatti S et al. Comparing Pap smear Cytology. Aided Visual Inspection, Screening colposcopy, cervicography and HPV testing as optional screening tools in Latin America. Study design and Baseline Data of the LAMS study. Anticancer research, 2005; 25: 3469-3480.
  14. Israt T. Study on HPV DNA test and conventional PAP test for identification of cervical intraepithelial lesions and cancer. MD thesis, Dept. of Pathology,2006; Bangabandhu Sheikh Mujib Medical University, Dhaka.
  15. Islam, Shamina. Relation of Human Papilloma Virus (HPV) load with cervical precancerous and cancerous lesions. MD thesis Department of Pathology,2013; Bangabandhu Sheikh Mujib Medical University, Dhaka.
  16. Xu Y, Dotto J, Hui Y, Lawton K, Schofield K, and Hui P, 2009. Grade cervical Intraepithelial Neoplasia and Viral load High risk Human Papilloma virus. Significant correlations in patients of 22 years old or younger Int. J. Clin. Exp.Path, 2009; 12:169-175.
  17. Zhao FH, Lewkowitz AK, Chen F, Lin MJ, HU, SY. Pooled analysis of a Self-sampling HPV DNA test as a Cervical Cancer Primary Screening Method. J. Natl Cancer Inst. 104:1-11 gynecol, 2012; 21(2):51-57.
  18. Castle PE, Solomon D, Wheeler CM, Gravitt PE, Watchholder S and Schiffman M. 2008. Human pailloma genotype Specificity of Hybrid capture-2 J Clin Microbiol, 2008;46 (8):2595.
  19. Schiffman M, Wentzensen N. From human papillomavirus to cervical cancer. Obstetrics & Gynecology, 2010; 116(1):177–185.


Correlation of Proliferation Index and Microvessel Density in Glial Tumors with WHO Tumor Grades

Correlation of Proliferation Index and Microvessel Density in Glial Tumors with WHO Tumor Grades

 *Begum A,¹ Kamal M²

Abstract

This study was carried out to find the association of proliferative index (PI) and microvessel density (MVD) in different histo-morphological grades of glial tumor according to WHO criteria. Paraffin embedded tissue blocks of 42 patients with glial tumors were included in this study. Ki-67 and CD 34 immunostaining were done in all cases and was compared with the WHO grade. Proliferation indix was detected by Ki-67 immunostaining and micro vessel densitywas detected by CD 34 immunostaining in glial tumors. Glial tumor was common in 3rd decade with male predominance. Most common location of glial tumor was frontal lobe 19.0%. Anaplastic astrocytoma (WHO grade III) in 21.4% cases and glioblastoma multiforme (WHO grade IV) in 21.4% cases was diagnosed commonly. Glioblastoma multiforme (WHO grade IV) had mean proliferative index 24.3±8.7%, anaplastic astrocytoma (WHO grade III) had 25.1±12.4%, diffuse fibrillary astrocytoma, (WHO grade II) 4.5±3.7% and pilocytic astrocytoma (WHO grade I) had 2±0.8%. The mean proliferative index difference was statistically significant (p<0.05) in different WHO grades. Glioblastoma multiforme (WHO grade IV) had mean MVD 100.11±46.62, anaplastic astrocytoma (WHO grade III) had 57.13±20.14, diffuse fibrillary astrocytoma (grade II) had 32.0±12.01 and pilocytic astrocytoma (WHO grade I) had 47.75±19.91. The microvessel density difference was statistically significant (p<0.05) in different WHO grades. A weak positive correlation was found between proliferative index and microvessel density in the 42 patients of glial tumors. Patients of low grade glial tumor with increased proliferative index and microvascular proliferation are at risk of progressing to higher grade tumor.

[Journal of Histopathology and Cytopathology, 2017 Jul; 1 (2):91-101]

Key words: Glial tumors, Tumor grades, Proliferation index, Ki-67 Labeling index, CD34, Microvessel density (MVD)


  1. *Dr. Afroza Begum, Assistant Professor of Pathology, Anwer Khan Modern Medical College and Hospital, Dhaka. afroza.mithila@gmail.com
  2. Mohammed Kamal, Professor, Department of Pathology, Bangabondhu Sheikh Mujib Medical University, Dhaka.


*For correspondence


Introduction

Glial tissue neoplasm is the most common intracranial tumors. Worldwide incidence of primary brain tumors is approximately seven per 100,000 individuals per year, accounting for 2% of all primary tumors1 40% of all primary Central Nervous System (CNS) tumors are Gliomas. 75% of which are Astrocytomas. Ependymomas, oligodendrogliomas and other subtypes includes the rest 25 %.2  Pathologic diagnosis of gliomas depends on established histopathologic criteria after examination of hematoxylin and eosin (H&E) stained slides of sampled tissue and grading on the basis of cellularity, nuclear atypia, mitotic activity, pseudopalisading necrosis and/or microvascular proliferation according to WHO classification of CNS neoplasms.3

Prognosis depends on several factors like age, preoperative status, extent of resection, and histopathological WHO grades along with mitotic count and necrosis in glial tumor. Prediction of clinical outcome in individual patient on the basis of grade alone is impossible as same tumor grade may behave differently. A continuous search for auxillary diagnostic and prognostic markers resulted for this limitation. Increased proliferative activity of tumor cells and micro vascular proliferation in tumor are associated with more aggressive tumor behavior and immunohistochemical techniques have been employed to quantitatively assess proliferative activity and micro vessel density in tumor tissue. The most reliable method to assess cell proliferation in gliomas is the antibody against Ki-67 antigen. The MIB-1 antibody identify a non-histone nuclear matrix protein associated antigen Ki-67 present in the nuclei of cells in the G1, S, G2 and M phases of the cell cycle, but is not expressed in the resting  G0 phase.4

Proliferation indices less than 1.5% were associated with longer survival and higher then 1.5% had shorter survivals. Proliferation index was particularly useful in WHO grade II and III tumors, as it identifies aggressiveness.5   However, a significant positive correlation between Ki-67 indices and histologic grade have demonstrated in many investigations and observed higher Ki-67 proliferation indices associated with shorter survivals. So, both the WHO grade and proliferation index have prognostic predictive value.4

CD 34 is used as an endothelial cell marker in order to study vascular proliferation in glial tumor; specially astrocytomas.6 Microvascular density is a measure of microvascular proliferation, which is also an independent prognostic factor for adult glioma.7  Angiogenesis is rate limiting for tumor growth, and therefore a rational therapeutic target.1.

The association of PI and MVD with different WHO grade of glial tumors has not been studied till now in Bangladesh. Results of studies by various authors in different countries show proliferation index and MVD correlate with different WHO grades of glial tumors and also in some cases, can predict progression of tumor from lower grade to higher grades. The aim of this study was to investigate the association of proliferative index measured with Ki-67 and microvessel density measured by CD34 with different histo-morphological grades of glial tumor according to WHO.

 Methods

Paraffin embedded tissue blocks of primary brain tumor diagnosed at the department of Pathology, BSMMU and other private pathology of Dhaka city were collected from the archive from the year 2012 to 2013. Forty two cases were selected for the study. Clinically suspected glial tumor but subsequently proved to be non-neoplastic conditions like demyelinating disease or reactive gliosis on histological examination, any CNS tumor other than glial tumor or metastatic tumor to CNS and samples without clinical data were excluded.

 Collection of clinical information

Detailed clinical information was obtained by taking history recorded in clinical proforma of departmental archives. Filling up of the clinical proforma was performed in all cases.

 Sectioning and staining of paraffin embedded tissue blocks for routine histopathological examination: The sections  were  cut and  stained  with  haematoxylin  and  eosin (H&E) staining method by using auto-stainer (Varistain 24-4 Automatic Slide Stainer, Thermo  Scientific,  USA) following  standard  protocol.  PAS staining of the slides were done according to the standard protocol followed at BSMMU and was used for the detection of three hot spots (area showing maximum vascularity) in the tissue sections. Slides of all cases were examined in light microscope after mounting in DPX.

 Methods used for immunohistochemistry (IHC)

For  IHC  stain,  2-3  µm  thick  tissue  sections  were  taken  from  the  paraffin  blocks  on coated  slide  (DAKO,  codeK8020). DAKO EnVision™+/HRP (Horseradish peroxidase) system which is based on advance Labeled Streptavidin-biotin (LSAB) method was used for visualizing the section. These methods were carried out manually.

 Scoring of Ki-67

It is done by the percentage of tumor cell nuclei allowing Ki-67 staining per total of 1000 neoplastic cells. One thousand tumor cells were counted in several areas of tissue where positively stained nuclei were evenly distributed. But in those cases with uneven distribution of positive nuclei, the tumor cells were counted in the areas with highest density of positive nuclei by visual analysis.8  In this study, 500 neoplastic cells were calculated and percentages of Ki-67 stained neoplastic cells were determined. Usually proliferative index of glial tumor with WHO grade-I has 0 to 3.9%, WHO grade-II has up to 4%, WHO grade-III has 5 to 10% and WHO grade-IV has 15 to 20% (WHO classification of tumors of the CNS, IARC, Lyon, 2007).

 MVD calculation

Brown staining of cytoplasm of endothelial cells with CD 34 was considered positive reaction. MVD were calculated according to Weidner’s method. At first the sections were scanned at low power (X10) looking for hot spots. Hot spot is an area with the most dense vessels growth. Only hot spots close to the tumor cell clusters in viable areas (non-necrotic and non-sclerotic areas) were included. When the hot spots were defined, microvessel count (MVC) was performed by counting the individual stained microvessels (at power X20) representing a field size of 0.74mm² (20X objective, 10X ocular; equivalent to 0.7386 mm² per 200X field.9 First three hot spots were chosen. In each hot spot, MVC was performed at power X20. Finally MVD was calculated as the mean of the total number of microvessels in these three hot spots.

 Statistical analysis

Statistical analyses of the results were obtained by windows based computer software devised with Statistical Packages for Social sciences (SPSS-17). The qualitative data were presented as numbers and percentages while the quantitative data were presented as mean, standard deviations and ranges. The results were calculated by using statistical formulae Chi-square test and and Fisher exact test was used only when the expected count in any cell found less than 5. Also the comparison between two groups with quantitative data was done by using Independent t-test and the comparison between three groups with quantitative data was done by using One Way ANOVA. Pearson correlation coefficient was used to assess the relations between the studied parameters.

 Results

The mean age was found 35.38±17.55 years with range from 4 to 82 years, highest occurrences observed in 3rd decade (31.0%) and almost three fourths 31 (73.8%) patients were male. Male female ratio was 2.8:1. Frequent site of involvement were frontal lobe 8 (19.0%) cases, parietal lobe 6 (14.3%) cases and temporal lobe 6 (14.3%) cases. (Table I)


Table I: Age, sex and tumor location in study cases


Clinical Variables Results
Age in years  
Mean±SD 35.38±17.55
Range (min-max) 4-82
Gender N (%)
Male 31(73.8 %)
Female 11(26.2 %)
Location of tumors  
Frontal lobe 8(19.0 %)
Parietal lobe 6(14.3 %)
Temporal lobe 6(14.3 %)
Temporoparietal lobe 4(9.5 %)
Frontoparietal lobe 2(4.8 %)
Frontotemporal lobe 2(4.8 %)
Parieto-occipital lobe 2(4.8 %)
Cerebral 4(9.5 %)
Spinal 2(4.8 %)
Ventricle 2(4.8 %)
Corpus callosum 1(2.4 %)
Cerebellum 1(2.4 %)
Posterior fossa 2(4.8 %)


9 (21.4%) patient had anaplastic astrocytoma, WHO grade III and glioblastoma multiforme WHO grade IV respectively and 6 (14.3%) cases had diffuse fibrillary astrocytoma WHO grade II. According to WHO grading majority 17 (40.7%) patients had grade II lesion followed by 12 (28.6%) had grade III lesion, 9 (21.4%) had grade IV lesion and 4 (9.5%) had grade I lesion. Anaplastic astrocytoma, WHO grade III had mean mitotic count 6.56±2.3 /10HPF ranging from 4 to 11 /10HPF. The glioblastoma multiforme WHO grade IV had mean mitotic count 8.11±2.76 /10HPF ranging from 5 to 12 /10HPF. Other results are depicted in this table. The mean difference was statistically significant (p<0.05). The findings are shown in table II.


All (100.0%) patients with glioblastoma multiforme WHO grade IV had necrosis and necrosis was not found in the remaining cases. Four patients had pilocytic astrocytoma WHO grade I among them 3(17.6%) had mild and 1(10.0%) had moderate nuclear pleomorphism. Nine patients had anaplastic astrocytoma, WHO grade III among them 1(5.9%) had mild, 5(50.0%) had moderate and 3(21.4%) had marked nuclear pleomorphism. Nine patients had glioblastoma multiforme WHO grade IV among them 2(20.0%) had moderate and 7(50.0%) had marked nuclear pleomorphism. Other results are depicted in this table VI. The difference was statistically significant (p<0.05) between three groups (Table: II).

Table II: Histopathological findings in different glial tumors of different grades

Histopathological Diagnosis WHO grades N (%) Nuclear pleomorphism Cellularity
(No. of cells/ HPF)
Mitoses/

10HPF

Mild
(n=18)
Moderate
(n=10)
Marked
(n=14)
N (%) N (%) N (%) Mean±SD Mean±SD
Pilocytic astrocytoma I 4(9.5) 3(17.6) 1(10.0) 0(%) 159.5±75.2 1.67±0.58
Diffuse fibrillary astrocytoma II 6(14.3) 5(29.4) 0(0.0) 1(7.1) 325.2±102.14 2.17±0.75
Ependymoma 5(11.9) 5(29.4) 0(0.0) 0(0.0) 249.0±97.58 2.80±1.10
Gemistocytic astrocytoma 2(4.8) 1(5.9) 0(0.0) 1(7.1) 234.5±31.82 6.0±1.41
Oligoastrocytoma 2(4.8) 2(11.8) 0(0.0) 0(0.0) 188.3±104.07 2.50±0.71
Oligodendroglioma 2(4.8) 1(5.9) 1(10.0) 0(0.0) 182.0±25.46 2.00±1.41
Anaplastic astrocytoma III 9(21.4) 1(5.9) 5(50.0) 3(21.4) 602.67±44.06 6.56±2.30
Anaplastic ependymoma 3(7.1) 0(0.0) 1(10.0) 2(14.3) 385.11±167.27 6.00±2.00
Glioblastoma multiforme IV 9(21.4) 0(0.0) 2(20.0) 7(50.0) 503.89±130.92 8.11±2.76
P     0.003s 0.001s 0.001s

Anaplastic astrocytoma WHO grade III had mean proliferative index 25.1±12.4% ranging from 8.8% to 40% (fig 1 and 2). The glioblastoma multiforme WHO grade IV had mean proliferative index 24.3±8.7% ranging from 15% to 40%. The gemistocytic astrocytoma WHO grade II had mean proliferative index 10.8±10.3% ranging from 3.5% to 18%. The anaplastic ependymoma WHO grade III had mean proliferative index 18.0±7.6% ranging from 10% to 25%. The mean difference was statistically significant (p<0.05).

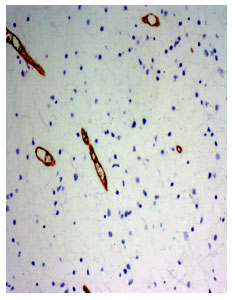
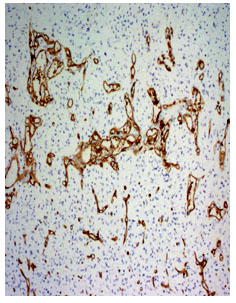
Anaplastic astrocytoma WHO grade III had mean MVD 57.13±20.14 ranging from 35 to 87. The glioblastoma multiforme WHO grade IV had mean MVD 100.11±46.62 ranging from 38 to 197 (fig 3 and 4). The oligoastrocytoma WHO grade II had mean MVD 110.5±68.59 ranging from 62 to 159. The mean difference was statistically significant (p<0.05) (Table III).

A positive correlation was found between proliferative index and microvessel density. The value of Spearmen’s correlation coefficient was 0.244 and it is not significant (p=0.119). Therefore, there was a weak association between proliferative index and microvessel density in the study population but not statistically significant (fig 5).

Table III: Proliferative index with histological diagnosis and WHO grades of different glial tumors


Histopathological Diagnosis WHO grades N (%) Proliferative index, Ki67 (%) Microvessel density,CD34
Mean±SD Mean±SD
Pilocytic astrocytoma I 4(9.5) 2.0±0.8 47.75±19.91
Diffuse fibrillary astrocytoma II 6(14.3) 4.5±3.7 32.0±12.01
Ependymoma 5(11.9) 3.0±3.1 41.0±19.58
Gemistocytic astrocytoma 2(4.8) 10.8±10.3 32.0±18.38
Oligoastrocytoma 2(4.8) 1.6±0.6 110.5±68.59
Oligodendroglioma 2(4.8) 1.0±0.0 52.0±5.66
Anaplastic astrocytoma III 9(21.4) 25.1±12.4 57.13±20.14
Anaplastic ependymoma 3(7.1) 18.0±7.6 51.0±25.94
Glioblastoma multiforme IV 9(21.4) 24.3±8.7 100.11±46.62
P-value     0.001s 0.002s


Fig 1. Photomicrograph of a diffuse fibrillary astrocytoma, WHO grade II (Ki67 immunosatin, x220)


Fig 2. Photomicrograph of  anaplastic astrocytoma WHO grade-III.  Many Ki67 positive cells are present (Ki-67 immunostain, x220)


Fig 3.  Photomicrograph of a diffuse fibrillary astrocytoma WHO grade-II (CD34  immunostain x210)


Fig 4. Photomicrograph shows glioblastoma multiformi WHO grade-IV (CD34 immuno stain, x210)


Fig 5. Scatter diagram showing Spearmen’s positive correlation (r=0.244; p=0.119) between proliferative index and microvessel density

Discussion

In this series it was observed that most of the patients (31.0%) having glial tumors were in the 3rd decade and their mean age was 35.38±17.55 years with age range from 4 to 82 years. Similarly, Chaloob et al.6 and Arshad et al.10 showed the mean age of the glial tumor patients was 35.98 years (age range 2-68 years) and 35 years (age range 5 – 67 years) respectively. Regarding the sex distribution of glial tumors, a number of investigators reported predominance of male. Gender distribution of astrocytoma cases showed slight male preponderance with 53.0% cases compared to female with 47.0% cases obtained by Chaloob et al.6  In another study Arshad et al.10 observed 70.0% and 30.0% were male and female respectively. Similarly, in this study almost three fourths (73.8%) of the patients were male and 26.2% were female. Male female ratio was 2.8:1, which is consistent with the study by Giannini et al.11 study, where they found male 61.6% and female 38.4% with a male to female ratio was 1.6:1.


The most common location of tumor of the patients in the present study was frontal lobe (19.0%) followed by parietal lobe (14.3%), temporal lobe (14.3%) and the temporoparietal and cerebral lobe (9.5%). Chaloob et al found that 33.3% cases were frontal, 31.4% cerebellar, 25.5% parietal and 9.8% temporal lobe.6

In case of WHO grades of glial tumors it was observed in this present series, most 9 (21.4%) patients had anaplastic astrocytoma, (WHO grade III) and glioblastoma multiforme (WHO grade IV) respectively and 6 (14.3%) patient had diffuse fibrillary astrocytoma (WHO grade II) and 4 (9.5%) patient had pilocytic astrocytoma (WHO grade I). Chaloob et al.6 found that 13.2% cases were pilocytic astrocytomas (WHO grade I), 43.1% cases were diffuse fibrillary astrocytomas (WHO grade II), 11.8% cases were anaplastic astrocytomas (WHO grade III) and 31.4% cases were glioblastomas (WHO grade IV), unlike the current study.

 The association between cellularity and WHO grades of glial tumor were also assessed in the present study. The mean cellularity was 503.89±130.92 cells/HPF ranging from 208 to 618 cells/HPF in glioblastoma multiforme (WHO grade IV). In anaplastic astrocytoma (WHO grade III), mean cellularity was 385.11±167.27 cells/HPF ranging from 189 to 600 cells/HPF. In ependymoma (WHO grade II), mean cellularity 325.2±102.14 cells/HPF ranging from 200 to 478 cells/HPF and in pilocytic astrocytoma (WHO grade I) 159.5±75.2 cells/HPF ranging from 100 to 268 cells/HPF. In this study there is a trend of little increasing of cellularity with WHO grades and the mean difference of cellularity significantly (p<0.05) differ with different WHO grades. Schiffer et al.12 stated that after multivariate analysis on the histologic parameters, cell density was more significant than number of mitoses. Cell density is categorized as follows: low (<400 cells X high-power field (HPF); medium (400 to 800 cells X HPF); or high (>800 cells nuclei in the most cellular regions of the section. In this study maximum value of cellularity is 648/HPF found in anaplastic ependymoma which is greater than GBM WHO grade-IV. Size of the specimen, representative biopsy and presence or absence of necrosis may affect the cellular density in various grades of glial tumors.

Nuclear pleomorphism alone is considered as an important factor for the recognition of malignancy.13  However, Schiffer et al.12 suggested caution because pleomorphic nuclei can be found in well-differentiated astrocytoma. It was observed in the present study that the association was significant. The current study found four patients had pilocytic astrocytoma, WHO grade I. Among them three (17.6%) had mild and one (10.0%) had moderate nuclear pleomorphism. Nine patients had anaplastic astrocytoma, WHO grade III. Among them one (5.9%) had mild, five (50.0%) had moderate and three (21.4%) had marked nuclear pleomorphism. Nine patients had glioblastoma multiforme WHO grade IV. Among them, two (20.0%) had moderate and seven (50.0%) had marked nuclear pleomorphism (WHO grade I and grade II) are consistent with mild nuclear pleomorphism, (WHO grade III) is regular with moderate and WHO grade IV, with marked nuclear pleomorphism. The association of WHO grades differ significantly (p<0.05) with nuclear pleomorphism.

Regarding the association between mitoses and WHO grades in glial tumors, it was observed in this current study that the mean mitotic count was 8.11±2.76 /10HPF ranging from 5 to 12 /10HPF in glioblastoma multiforme (WHO grade IV), 6.56±2.3 /10HPF with range 4 to 11 /10HPF in anaplastic astrocytoma (WHO grade III), 6.00±2.0 /10HPF ranging from 4 to 8 /10HPF in anaplastic ependymoma (WHO grade III), 6.00±1.41 /10HPF with range 5 to 7 /10HPF in gemistocytic astrocytoma, (WHO grade II), 2.80±1.1 /10HPF ranging from 2 to 4 /10HPF in ependymoma (WHO grade II), 2.50±0.71 /10HPF ranging from 2 to 3 /10HPF in oligoastrocytoma, (WHO grade II), 2.17±0.75 /10HPF ranging from 1 to 3 /10HPF in diffuse fibrillary astrocytoma, (WHO grade II), 2.00±1.41 /10HPF ranging from 1 to 3 /10HPF in oligodendroglioma, (WHO grade II) and 1.67±0.58 /10HPF ranging from 1 to 2 /10HPF in pilocytic astrocytoma (WHO grade I). The above result indicates that there is a linear increase of mitotic count with increasing WHO Grades.

In the present study it was observed that all (100.0%) patients with glioblastoma multiforme (WHO grade IV) had necrosis but no necrosis was found in other WHO grades. The mean difference was statistically significant (p<0.05). According to WHO classification of tumors of the central nervous system, IARC: Lyon 2007, necrosis may be of any type is one of the major histologic features of WHO grade IV glial tumors. Peri necrotic pallisading of tumor cells need not be present. Giannini et al.11 stated that proliferation index was not an independent marker of prognosis when grade IV tumors were considered. The presence of necrosis was a very statistically powerful predictive marker for grade IV tumors. Limited blood supply and hypoxia due to sluggish blood flow and interstitial oedema has been identified as important causes of necrosis.1

Many investigations have demonstrated a significant positive correlation between Ki-67/MIB-1 indices and WHO grades. It was observed in this study that the mean proliferative index was 24.3±8.7% ranging from 15 – 40% in glioblastoma multiforme (WHO grade IV), 25.1±12.4% ranging from 8.8 – 40% in anaplastic astrocytoma (WHO grade III), 18.0±7.6% ranging from 10–25% in anaplastic ependymoma (WHO grade III), 10.8±10.3% ranging from 3.5-18.0 in gemistocytic astrocytoma, (WHO grade II). 4.5±3.7% ranging from 1.0 -10.0% in diffuse fibrillary astrocytoma, (WHO grade II), 3.0 ± 3.1% ranging from 1.0- 8.0 in ependymoma (WHO grade II), 1.6±0.6% ranging from 1.1 -2.0% in oligoastrocytoma, (WHO grade II), 1.0±0.0% in oligodendroglioma, (WHO grade II) and 2.0±0.8% ranging from 1.1 -3.0% in pilocytic astrocytoma (WHO grade-I). There is a linear increase of proliferative index with increasing WHO grades. The mean Proliferative index significantly (p<0.05) differed with different WHO grades. Proliferation marker is helpful in cases where clinical or histopathologic factors are ambiguous. As part of a larger study of proliferation and prognosis, Giannini et al.11 studied the MIB-1 index as an independent prognostic factor in 140 diffuse astrocytomas, including 45 grade II, 50 grade III and 45 grade IV. MIB-1 indices were higher in grade III than in grade II (P = 0.001) and were higher in grade IV than in grade III (P = 0.014). Giannini et al.11 also mentioned that the MIB-1 proliferation index was particularly useful in grade II and III because it identifies aggressive tumors in the grade II category.

The study revealed that MVD by CD34 is significantly different between astrocytomas. MVD is increased with the progression of the pathological grade of astrocytoma. Significant differences of MVD were found among astrocytomas of different grades. Regarding the association between diagnosis and WHO grades with microvessel density it was observed that oligoastrocytoma (WHO grade II) had mean microvessel density 110.5±68.59 ranging from 62 -159, oligodendroglioma, (WHO grade II) 52.0±5.66 ranging from 48 – 56, ependymoma (WHO grade II) 41.0±19.58 ranging from 21 – 72, diffuse fibrillary astrocytoma, (WHO grade II) 32.0±12.01 ranging from 17 – 50, gemistocytic astrocytoma, ( WHO grade II) 32.0±18.38 ranging from 19 – 45, glioblastoma multiforme (WHO grade IV) 100.11±46.62 ranging from 38 – 197, anaplastic astrocytoma, (WHO grade III) 57.13±20.14 ranging from 35 – 87, anaplastic ependymoma (WHO grade III) 51.0±25.94 ranging from 30 – 80, pilocytic astrocytoma (WHO grade I) had mean microvessel density 47.75±19.91 ranging from 26 – 70. The mean microvessel density was higher in WHO grade II and WHO grade IV. The mean microvessel density difference was significantly (p<0.05) differ with different WHO grades.

Spearmen’s positive correlation (r=0.244; p=0.119) was found between proliferative index and microvessel density but not significant (p>0.05). Cavalcante et al.14 stated that association between SPECT-MIB1 and the MVD of low grade astrocytoma, anaplastic astrocytoma and glioblastoma multiforme cases were not significant. But Safy et al.15 showed significant correlation between Ki67 (PI) and CD34 (MVD) which is consistent with my study.

 Conclusion

The prognostic utility of proliferative indices among the gliomas (WHO grades I to IV) has been debated and evaluated that the proliferative index is an independent prognostic marker for survival. The determination of a proliferation index is not a routine part of the evaluation of all gliomas, due to limitations associated with tumor heterogeneity and sampling, as well as differences in staining methodology, index determination, and the degree of inter-observer variability. It may be prognostically helpful in histologically borderline cases, such as those that are at the grade II–III and III–IV border. Raised proliferation index indicates a more aggressive neoplasm or tumor progressing to higher grade. Like in this study, six patients out of nine with anaplastic astrocytmas WHO grade-III, had proliferation index >10% indicating progression toward GBM. Among WHO grade II glial tumors in the study, one case of gemistocytic astrocytoma, one case of ependymoma and one case of diffuse fibrillary astroytoma  had proliferation index >4% suggesting progress to a higher grade gliomas. Moreover it correlates with the WHO grades. The transition from low-grade to anaplastic astrocytomas or anaplastic astrocytomas to secondary GBM is a dramatic increase in microvascular proliferation. An equivalently robust microvasculature proliferation phenotype is observed also in primary GBM. Vredenburgh et al.16 stated that the combination of anti angiogenesis therapy (bevacizumab) and cytotoxic therapy (irinotecan) is an active regimen for recurrent grade III-IV glioma with acceptable toxicity. Thirty-two patients were assessed (23 with grade IV glioma and 9 with grade III glioma). The median progression-free survival was 23 weeks for all patients. So it can be said that addition of anti-angiogenesis drugs would be beneficial for patients with increased microvessel density in glial tumors. This study may also help the oncologist to select anti angiogenesis therapy along with conventional treatment of glial tumor which show increased MVD. More over, patients of low grade glial tumor with increased proliferative index and microvascular proliferation are at risk of progressing to higher grade tumor. This cases can be detected and predicted as risk group for close monitoring and follow up.

Acknowledgements

The authors acknowledge contribution of

  1. Shabnam Akhter, Associate Professor, Department of Pathology, in preparing the manuscript
  2. Tasmina Anam, Medical Officer, Department of Pathology for immunohistochemical staining

 References

  1. Furnari FB, Fenton T, Bachoo RM, Mukasa A, Stommel JM, Stegh A, et al. Malignant astrocytic glioma: genetics, biology, and paths to treatment. Genes & development 2007; 21(21):2683-710.
  2. Grier JT, Batchelor T. Low-grade gliomas in adults. The Oncologist, 2006; 11(6):681-93.
  3. Kleihues P, Cavenee WK. Pathology and genetics of tumours of the nervous system. InPathology and genetics of tumours of the nervous system 2000 Lorger M. Tumor microenvironment in the brain. Cancers, 2012; 4(1):218-43.
  4. Brat DJ, Prayson RA, Ryken TC, Olson JJ. Diagnosis of malignant glioma: role of neuropathology. Journal of neuro-oncology, 2008;89(3):287-311.
  5. Hsu DW, Louis DN, Efird JT, Hedley-Whyte ET. Use of MIB-1 (Ki-67) immunoreactivity in differentiating grade II and grade III gliomas. Journal of Neuropathology & Experimental Neurology. 1997;56(8):857-65.
  6. Chaloob MK, Ali HH, Qasim BJ, Mohammed AS. Immunohistochemical expression of Ki-67, PCNA and CD34 in astrocytomas: a clinicopathological study. Oman Medical Journal, 2012;27(5):368-74.
  7. Leon SP, Folkerth RD, Black PM. Microvessel density is a prognostic indicator for patients with astroglial brain tumors. Cancer, 1996;77(2):362-72.
  8. Ralte AM, Sharma MC, Karak AK, Mehta VS, Sarkar C. Clinicopathological features, MIB-1 labeling index and apoptotic index in recurrent astrocytic tumors. Pathology & Oncology Research, 2001;7(4):267-78.
  9. Weidner N, Folkman J, Pozza F, Bevilacqua P, Allred EN, Moore DH, et al. Tumor angiogenesis: a new significant and independent prognostic indicator in early-stage breast carcinoma. CancerSpectrum Knowledge Environment, 1992;84(24):1875-87.
  10. Arshad H, Ahmad Z, Hasan SH. Gliomas: correlation of histologic grade, Ki67 and p53 expression with patient survival. Asian Pac J Cancer Prev, 2010;11(6):1637-40.
  11. Giannini C, Scheithauer BW, Burger PC, Christensen MR, Wollan PC, Sebo TJ, et al. Cellular proliferation in pilocytic and diffuse astrocytomas. Journal of Neuropathology & Experimental Neurology, 1999;58(1):46-53.
  12. Schiffer D, Chiò A, Giordana MT, Leone M, Soffietti R. Prognostic value of histologic factors in adult cerebral astrocytoma. Cancer, 1988;61(7):1386-93.
  13. Nelson DF, Nelson JS, Davis DR, Chang CH, Pajak TF. Survival and prognosis of patients with astrocytoma with atypical or anaplastic features. Journal of neuro-oncology. 1985;3(2):99-103.
  14. Pantoja Cavalcante S, De Almeida JR, Clara CA, Scapulatempo Neto C, Verzinhase Peres S, Moriguchi SM, et al. Evaluation of the microvascular density in astrocytomas in adults correlated using SPECT-MIBI. Experimental and Therapeutic Medicine. 2010;1(2):293-9.
  15. Safy HME, Hamied HEA, Hassan RA, Rezk HM, Ahmed EM, Farag The role of immunohistochemical markers in diagnosis and prognosis of diffuse astrocytoma. Life Science Journal, 2013:12(10): 365-371.
  16. Vredenburgh JJ, Desjardins A, Herndon JE, Dowell JM, Reardon DA, Quinn JA, et al. Phase II trial of bevacizumab and irinotecan in recurrent malignant glioma. Clinical cancer research. 2007;13(4):1253-9.