Computed Tomogram Guided Fine-Needle Aspiration Cytology of Lung and Mediastinal Masses: A Study of 166 Cases

Computed Tomogram Guided Fine-Needle Aspiration Cytology of Lung and Mediastinal Masses: A Study of 166 Cases

*Alam MA,1 Islam MR,2 Haque MR, Nath SK4

 Abstract
Computed tomogram guided fine needle aspiration cytology (FNAC) is an important and useful investigation to differentiate between benign and malignant lesions of lung and mediastinum. To evaluate the lung and mediastinal masses and to analyze and compare the results with cytological findings, 166 patients were retrospectively studied who underwent CT guided FNAC over a period of January 2015 to December 2016. The study was carried out in patients who presented with respiratory symptoms with a localized lung and mediastinal masses which were confirmed by radiologically was sent for FNAC. 155 cases of lung masses and 11 cases of mediastinal mass were included in this study. Patients’ age ranged from 15 to 95 year and the male to female ratio was 4:1. Radiologically, out of 166 cases, 140 cases were diagnosed as malignant, 8 cases as benign and 18 cases as inflammatory lesions. Cytologically, 146 cases were diagnosed as malignant, 20 cases were benign inflammatory lesion. Most common lung malignancy was squamous cell carcinoma (72 cases) followed by adenocarcinoma (32 cases), small cell carcinoma (10 cases), large cell carcinoma (8 cases), 18 cases of lung metastasis were seen. Compared to biopsy, CT guided FNAC shortens the diagnostic interval and helps in differentiating lung malignancy into different cytopathological types which aids in proper management of the malignant lesion. Out of 11 mediastinal masses 6 cases were malignant lymphoma, 3 cases specific inflammatory lesions (tuberculosis) and 2 cases was non-specific inflammatory lesions.

[Journal of Histopathology and Cytopathology, 2018 Jan; 2 (1):19-22]

Keywords: Computed tomogram, Cytology, Guided FNAC, Lung mass, Mediastinal mass.


  1. *Dr. Md. Ashraful Alam, Associate Professor, Department of Pathology, Rangpur Medical College. drashraful09@gmail.com
  2. Md. Rezaul Islam, Senior Consultant, Radiology & Imazing, Sadar Hospital, Nilphamari.
  3. Md. Rashedul Haque, Associate Professor, Department of Biochemistry, Rangpur Medical College.
  4. Professor Swapan Kumar Nath, Department of Radiotherapy, Rangpur Medical College.


* For correspondence

 Introduction

A Computed tomography (CT) guided fine needle aspiration cytology (FNAC) is a well known modality for characterization of mediastinal masses. CT guided FNAC of lung lesions is a well established technique for the cytologic diagnosis of peripheral malignant lung lesions, with a reported diagnostic accuracy rate more than 93% and a sensitivity rate less than 95%.1,2 It has been used to differentiate mediastinal masses into benign, malignant and inflammatory types. Furthermore, its use has been extended in differentiating lung malignancy into different cytopathological types which aids in proper management of the malignant lesions. CT guided FNAC is widely recognized technique in indeterminate mass. It is a simple diagnostic method of relatively low cost, with negligible mortality and limited morbidity.3 The accuracy of CT guided FNAC for discriminating benign from malignant lesion has been recorded to vary from 64% to 97%.4 Several post procedural complications have been reported for CT guided FNAC such as pulmonary hemoptysis and pneumothorax. The risk for developing pneumothorax has been observed to be 22% – 45% due to high sensitivity of CT in detecting pneumothorax.5 Relative contraindications to image guided FNAC are severe chronic obstructive airway disease, bleeding diathesis, contra lateral pneumonectomy and pulmonary arterial hypertension.6 The purpose of our study is to evaluate the accuracy of CT and CT guided FNAC in differentiating and recording the pathological spectrum of the mediastinal and lung masses.

 Methods

This is a retrospective study conducted in a private medical college hospital at Rangpur and two private laboratories in Rangpur city from Janary 2015 to December 2016.The study was carried out in 166 patients who presented with lung and mediastinal mass attended to different physicians and Rangpur Medical College Hospital and were sent for Fine needle aspiration cytology. Relevant clinical history and investigations were obtained from the patient to narrow down the differential diagnosis and to decide if patient was eligible for FNAC, such as history of bleeding diathesis, thrombocytopenia, dyspnea, uncontrolled cough, other feature of chronic obstructive airway diseases (COPD), pulmonary arterial hypertension etc. CT guided FNAC was performed in patients with peripheral lung and mediastinal mass or masses which were only approachable by spinal needle. Patient inclusion criteria included: cooperative patient who was able to hold breath for a short while, no bleeding tendency, patient who was to undergo chemo or radio-therapy and lesions not approachable by USG. Informed and written consent was taken from the patient explaining the risk and benefits of the procedure. Axial section of the area of interest was taken after a scanogram. A feasible approach was judged and the patient positioned accordingly with radiopaque marker placed at the site of puncture. Then under all aseptic precaution aspiration done by 21-22 G spinal needle and 10 cc disposable syringe and smear was prepared in glass slide for fixation in 95% alcohol. Routine Papaniculau stain were done in all cases.

 Results

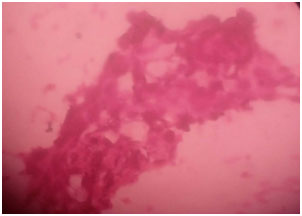
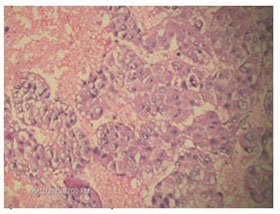
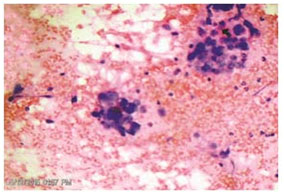
The data were collected from January 2015 to December 2016. Our study included 166 patients, out of which 155 with lung and 11 with mediastinal mass were subjected to CT guided FNAC. Their ages ranged from 15 to 95 years with mean age of 65 years (Table I). The male to female ratio was 4:1. Out of 155 lung  malignant cases squamous cell carcinoma (Fig 1, 72 cases) was the commonest followed by adenocarcinoma ( fig 2, 32 cases), 10 cases of small cell carcinoma, 8 cases of large cell carcinoma were seen. Out of 18 cases of metastatic tumors, 10 cases were from gastrointestinal tract, 2 cases from testis and 6 cases from thyroid follicular carcinoma (Table IV). Out of 15 inflammatory cases 7 cases was specific inflammatory (tuberculosis) 8 cases was non- specific inflammatory lesion was observed. (Table IV). Out of 11 mediastinal masses 6 cases were malignant lymphoma,3 cases ware specific inflammatory lesions(tuberculosis) and 2 cases were non-specific inflammation was observed (Table V).

Table I: Age distribution (n=166)

Age Groups
(Years)
Male Feamle Total %
15-25 6 3 9 5.42%
26-35 5 3 8 4.81%
36-45 13 4 17 10.42%
46-55 24 13 37 22.28%
56-65 30 12 42 25.30%
66-75 34 3 37 22.28%
>75 15 1 16 9.6%


Table II: Sites of the lesions (n=166)

Sites No %
Pulmonary 155 93.37
Mediastinal 11 6.62

Table III: Lung lesions by site and sex


Sex Site
Right Lung Left lung Total
Male 102(76.69%) 31(18.67%) 133(80.12%)
Female 20(60.60% 13(39.39%) 33(19.87%)
Total 122(73.49%) 44(26.50%) 166


Table IV: CT guided FNAC diagnosis of intrathoracic and mediastinal masses (n=166)


Cytological Findings: No(%)
Squamous cell carcinoma 72(43%)
Adenocarcinoma 32(19.27%)
Small cell carcinoma 10(6.02%)
Large cell carcinoma 8(4.81%)
Metastatic carcinoma 18(10.84%
Malignant Lymhoma 6(3.61%)
Specific Inflammatory lesions(TB) 10(6.02%)
Non specific inflammatory lesion 10(6.02%)


Table V: CT guided FNAC diagnosis of mediastinal masses (n=11)


Cytological Findings: No (%)
Malignant lymphoma 6(54.54%)
Specific Inflammatory lesion(TB) 3 (27.27%)
Non-specific inflammatory lesion 2(18.18%)

TB=Tuberculosis


Figure 1. Photomicrograph of sqamous cell carcinoma of lung (Cytopathology)
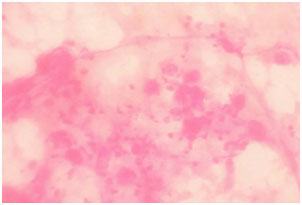


Figure 2. Photomicrograph of adeno carcinoma of lung (Cytopathology)

 Discussion

CT guided transthoracic FNAC is a safe and accurate means of diagnosing benign and malignant intrathoracic lesions. In this study, Out of 166 patients 5.42% were in the age group from 15-25 years and 25.30%were in the age group of 56-65 years which is not similar with the study of Sarker RN et. al 7 who found patients of intra-thoracic mass 36% in the age group ranging from 46-55 years and 21% in the age group of 56-65 years, these two groups were predominant in terms of age. There were 133  male (80.12%) and 33 female (19.67%). In the study of Sarker RN et. al7 out of 100 cases there were 77 men (77%) and 23 (23%) were women. This correlates with the well-known fact that intrathoracic mass occurs most commonly in older age group and in males than in females. Female cases are less because malignant pulmonary lesions are less in females in our population. Male: Female ratio was 4:1 in our study. That is similar to the study done by Ahmed et al.8 The locations of the pulmonary lesions were in right lung 122 (73.49%), and 44 (26.50%) in left lung. In the study of Ahamad et al8 lesion in right lung was 98 (60.49%), in left lung 64 (39.41). In the final diagnosis, squamous cell carcinoma was the commonest malignant tumour followed by adenocarcinoma and metastatatic carcinoma. These findings are similar to the findings of the study done by Mostafa et al9 although his study was not guided by CT and the number of cases was less. Our experience is similar to the study of Singh et al10 where fatal complications like tension pnemothorax, air embolism, endo bronchial haemmorhage etc were absent. The complication rate depends on the distance of the lesion from pleura and lesion size. The more the amount of the lung tissue traversed by the needle the more was the complication rate and smaller the lesion the more was the complication rate. In this study fine needle of 21- 22G was used where the chance of complication seems to be minimum which correlates well with the study of Zavala et al.11  Saha A et al12 in their series have reported cases of mediastinal masses, 3 (5.6%) cases was NHL and (1cases) was Hodgkin’s lymphoma.In our study 6 cases (54.54%) was malignant lymphoma. This discrimination may be due to total number of cases.

Conclusion

This study concludes that CT guided lung and mediastinium needle aspiration cytology by spinal needle is a highly effective procedure in the diagnosis and sub- classification of mass lesions. It is a relatively simple, cost effective procedure with good patient compliance and low morbidity. The use of CT-guided FNAC of intrathoracic mass lesions reduces the diagnostic interval and cost. It also avoids unnecessary thoracotomy for diagnostic purposes. As the facilities continue to improve; it is likely to have a greater role in the initial evaluation of intrathoracic and mediastinal mass in the near future.

 References

  1. Wallace MJ, Krishnamurthy S, Broemeling LD, Gupta S,Ahrar K, Morello FA Jr, et al. CT-guided percutaneous fine needle aspiration biopsy of small (<1 cm) pulmonary lesions. Radiology 2002; 225:823-8.
  2. Laurent F, Latrabe V, Vergier B, Mountadon M, MernejouxJM, Dubrez J. CT-guided transthoracic needle biopsy of pulmonary nodules smaller than 20 mm: results with an automated 20-gauge coaxial cutting needle. Clin Radiol 2000; 55:281-7.
  3. Santambrogio L, Nosotti M, Bellaviti N et al. CT Guided Fine Needle Aspiration Cytology of Solitary Pulmonary Nodules. Chest1997; 112:423-5.
  4. Mohammad GM. CT guided fine needle aspiration cytology in diagnosis of thoracic lesions. JIMA 2001; 99(10):1-5.
  5. Herman PG, Hessel SJ. The diagnostic accuracy and complications of closed lung biopsies. Radiology 1977; 125:11-4.
  6. Hensell DM: Interventional techniques. In Armstrong P,Wilson AG, Dee P, et al (eds): Imaging Of Diseases Of TheChest. 2nd ed . St. louis, Mosby, 1995, p. 894-912.
  7. Sarker RN, Rabbi AF, Hossain A, Quddus MA, Chowdhury N, Sarker T. Computed tomography guided transthoracic fine needle aspiration cytology in the diagnosis of Sonographically non-approachable intrathoracic masses-A study of 100 cases.J Dhaka Med Coll 2011; 20(1):25-31.
  8. Ahmed S, Ahamad M S U. Computed tomography guided fine needle aspiration cytology of lung lesions: A study of162 cases. JCMCTA 2009; 20 (1):50-2.
  9. Mostafa MG. Computed tomographic guided fine needle aspiration cytology in the diagnosis of thoracic lesions. J Indian Med Assoc 2001; 99(10): 550-3.
  10. Singh JP, Garg L, Setia V. Computed tomography (CT) guided transthoracic needle aspiration cytology in difficult thoracic mass lesions – not approachable by USG. IJRI, 2004; 14(4):395-400.
  11. Zavala DC, Bedell GN. Transthoraciclung biopsy with a cutting needle. Am Rev Respir Dis 1972; 106: 186-93.
  12. Saha A, Kumar K, Choudhuri M K. Computed tomography – guided fi ne needle aspiration cytology of thoracic mass lesions: A study of 57 cases. J cytol 2009; 26 (2):55-9.
 

Evaluation of Space Occupying Lesion of Liver by Fine Needle Aspiration Cytology and Cell Block Examination

Evaluation of Space Occupying Lesion of Liver by Fine Needle Aspiration Cytology and Cell Block Examination

*Sultana SS,1Dewan RK,2 Ferdousi F,3 Sarker R,4 Jinnah SA,5 Jeba R,6 Haque N,7 Hussain M8

 To differentiate between benign from  malignant  tumor and hepatocellular carcinoma from metastatic carcinoma in hepatic space occupying lesion on the basis of cytology and cell block examination this study was done. This was a descriptive cross sectional study comprising of 48 cases, carried out at the department of pathology, Dhaka Medical College during the period of July 2013 to June 2015. Results of all patients were collected and tabulated. Statistical analysis was performed  on tabulated data. Out of 48 cases, the cytological diagnosis  revealed the highest number of cases of hepatocellular carcinoma 22(45.8%), followed by metastatic carcinoma 13(27.1%), abscess 6(12.5%), hepatocellular dysplasia 3(6.3%) and negative for malignant cell 4(8.3%). Of the total 42 cases of space occupying lesion evaluated by cytology, the diagnoses were similar in cell block, the another six cases contains necrotic debris and cytologically proved as abscess. This measure of agreement is statistically significant with substantial agreement between cell block and cytology status in evaluation of space occupying lesion in liver. Fine needle aspiration cytology in case of space occupying lesion of liver can be relied upon to differentiate between benign and malignant lesion and also primary from secondary lesion. Simultaneous preparation of cell block give no hazard to the patient but provide maximum benefit.

[Journal of Histopathology and Cytopathology, 2018 Jan; 2 (1):11-18]

 Key words: Liver, Lesions, cytology, Cell block

  1. *Dr. Sk Salowa Sultana, Assistant Professor, Department of Pathology, Ad-Din Women’s Medical College, Dhaka. salowasultana257@gmail.com
  2. Professor Dr. Rezaul Karim Dewan, Professor & Head, Department of Pathology, Dhaka Medical College, Dhaka
  3. Farjana Ferdousi Lecturer, Department of Cytopathology, National Institute of Cancer Research & Hospital.
  4. Rabindranath Sarker, Associate Professor, Department of Radiology and Imaging, Dhaka Medical College. Dhaka
  5. Shahed Ali Jinnah, Associate Professor, Department of Pathology, Dhaka Medical College, Dhaka
  6. Ruksana Jeba, Associate Professor, Department of Pathology, Dhaka Medical College, Dhaka
  7. Najmul Haque, Former Associate Professor, Department of Pathology, Dhaka Medical College, Dhaka
  8. Professor Dr. Maleeha Hussain, Former Professor & Head, Department of Pathology, Dhaka Medical College, Dhaka.


*For correspondence

 Introduction

Liver diseases are common health problem throughout the world. Liver diseases are broadly categorized as diffuse and focal lesion. The differential diagnosis of focal lesions are primary liver tumors (benign and malignant), metastatic deposits, congenital and acquired cysts and abscess.1 Appropriate clinical management depends on accurate diagnosis but evaluation of the lesion is a common clinical problem.2 Imaging techniques and serological markers are useful in narrowing the differential diagnosis. Fine needle aspiration cytology (FNAC) mainly indicated in the diagnosis of malignant focal lesions both primary and secondary. FNAC also performed to rule out neoplasm from inflammatory lesion when radiologically inconclusive.3-6

Hepatocellular carcinoma (HCC) is responsible for a large proportion of cancer death worldwide. Also there are demographic variation in the incidence of HCC.7 GLOBOCAN global analysis published moderately high incidence (11-20 per 100,000) in Southeast Asia and also shows 82% of liver cancer cases occurring in developing countries. HCC is preceded by cirrhosis of the liver in most cases. The majority of them are due to viral hepatitis. Indeed, worldwide 50-80% of HCC is due to HBV and (10-25)% of cases are due to HCV infection respectively.8 Dual infection with HBV and  HCV is not uncommon in southeast Asia.9 Other causes include alcoholic liver disease, nonalcoholic steatohepatitis, intake of aflatoxin contaminated foods, diabetes and obesity.10

Liver is the most common site of distant metastasis as it filters most of the blood from the body.11 Metastasis commonly arise from tumor of colon, pancreas, breast and lung. Accurate diagnosis of the metastatic lesions is essential in determining the stage of tumor and also for therapeutic and prognostic purposes.  The  treatment vary  from  palliative care to partial hepatectomy, specially in those which are potentially chemosensitive or hormonally manipulable. Correlation of clinical, laboratory and radiologic findings is necessary. Radiologically multiple nodules of various sizes distributed randomly suggest metastases5.

The present study was done to evaluate the space occupying lesion of liver by fine needle aspiration cytology accompanying with cell block examination. There are some pitfalls in cytology associated with aspiration of necrotic material and presence of  regenerative atypia in hepatocytes. Some of these pitfall can be minimized by using cell block.  In cell block, architectural pattern,  thickening of cell plate and traversing blood vessels with their lining endothelial cells can be seen. Simultaneous preparation of cellblock  from the residual material after smear preparation can help to evaluate the difficult cases.12

 Methods

This is a descriptive cross sectional study which was carried out at the department of pathology, Dhaka Medical College, during the period of July, 2013 to June, 2015. The study was done on fine needle aspiration material of liver SOL that were received from Dhaka Medical College and Hospital, and Bangabandhu Sheikh Mujib Medical University (BSMMU).

Patients with radiologically diagnosed SOL in liver and suspected as a case of hepatic neoplasm were included in this study. Patient with bleeding disorders, prolonged prothrombin time,  Patient with liver abscess, cyst, haemangioma and already diagnosed cases were excluded from this study.

Relevant clinical informations were recorded. Patients having suspected hepatic neoplasm with good coagulation profile underwent ultrasound guided FNAC. According to standard protocol FNAC was done by an expert pathologist or radiologist and USG  guidance was provided by an expert radiologist.

Several cytologic smears were prepared and fixed immediately in 95% alcohol. The smears were left in alcohol at least for 30 minutes at room temperature before staining. The residual material remaining after completion of cytological smears  were fixed in 10% formalin and later processed to prepare paraffin embedded blocks .

 Smears prepared were stained by papanicolaou stain. Cell blocks were prepared by fixed sediment and bacterial agar method and stained by Hematoxyllin and eosin. Cytopathological examination of the stained slides of hepatic SOL were carried out under light microscope on the same day or next day. Satisfactory smears contained adequate number of representative cells from the target sites. Stained cell block sections were examined to compare  the cytological diagnosis.

Results

Table I shows age of the study patients, half of the patients belonged to age 51-70 years. The mean age was found 53.0±15.0 years with range from 18 to 90 years.

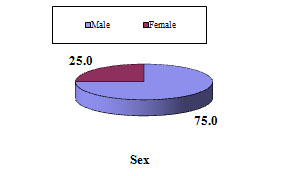
It was observed that three fourth (36, 75.0%) patients were male and 12(25.0%) patients were female. Male female ratio was 3:1.

Table II shows cytological diagnosis of the study patients. It was observed that almost half of the patients (45.8%) were found HCC followed by 13(27.1%) were metastasic Ca, 6(12.5%) were abscess and 3(6.3%) were hepatocellular dysplasia .

Table III shows presenting complaints of the study patients. Total 29 patients present with abdominal pain only. Nine patients presented with abdominal lump and  pain.

Table IV shows 22 patients were cytologicaliy  diagnosed as HCC. Among them 11(50.0%) were HBsAg positive and  2(9.1%)  were Anti HCV positive. No case was dual positive. In case of, 42 patients the tumor size was >3 cm, among them 2(66.7%) patients cytologically diagnosed as hepatocellular dysplasia, 22(100.0%)  HCC, 13(100.0%) metastatic carcinoma and 5(83.3%)  abscess. Total 28 patients presented with multiple SOL. Among them 10 (45.5%)  were HCC and 11(84.6%)  were metastatic carcinoma.

The association between cell block and cytology status in evaluation of space occupying lesion of liver is given in table VI. Of the total 42 cases of space occupying lesion evaluated by cytology, the diagnosis of 3(75.0%) negative for malignant cell, 2(66.7%) hepatocellular dysplasia, 20(90.9%) HCC and 8(61.5%) metastatic tumour were also similar by cell block. The results of the two methods (cell block and cytology status) analysis found Kappa value = 0.680 with p<0.05. This measure of agreement is statistically significant with substantial agreement between cell block and cytology status in evaluation of space occupying lesion in liver. One of the three cytologically diagnosed hepatocellular dysplasia one was finally proved as HCC after cell block examination.

 Table I: Distribution of the study patients by age (n=48)


Age (years) Number of patients Percentage
≤30 4 8.3
31-50 17 35.4
51-70 24 50.0
>70 3 6.3
Mean±SD 53.0 ±15.0
Range (min-max) 18 -90


Table II: Distribution of the study patients by cytology (n=48)


Cytology Number of patients %
Negative 4 8.3
HD 3 6.3
HCC 22 45.8
Abscess 6 12.5
MetastasicCa 13 27.1
        Adenocarcinoma 9 18.8
        Sq. CC 1 2.1
        RCC 1 2.1
        GIST 1 2.1
        Small cell Ca 1 2.1


Table I11: Distribution of the study patient with different  cytological diagnosis according to  clinical feature (n=48)


Clinical feature Cytological diagnosis
Negative

(n=4)

HD

(n=3)

HCC

(n=22)

Metastatic Ca

(n=13)

Abscess

(n=6)


n % N % n % n % n %
Abd lump only 0 0.0 0 0.0 0 0.0 3 23.1 0 0.0
Abd pain only 3 75.0 1 33.3 15 68.2 5 38.5 5 83.3
Lump + pain 0 0.0 1 33.3 7 31.8 1 7.7 0 0.0
Pain + ascitis 0 0.0 0 0.0 0 0.0 1 7.7 0 0.0


Table IV: Distribution of cytologically diagnosed cases  with viral marker (n=48)


Viral marker Cytologcal diagnosis
Negative

(n=4)

HD

(n=3)

HCC

(n=22)

MetastasicCa

(n=13)

Abscess

(n=6)

n % n % N % N % n %
HBsAg
Positive 1 25.0 0 0.0 11 50.0 0 0.0 0 0.0
Negative 3 75.0 3 100.0 11 50.0 13 100.0 6 100.0
Anti HCV
Positive 0 0.0 0 0.0 2 9.1 0 0.0 0 0.0
Negative 4 100.0 3 100.0 20 90.9 13 100.0 6 100.0


Table V: Association between cytology status with USG finding (n=48)


USG finding Cytologycal diagnosis P value
Negative

(n=4)

HD

(n=3)

HCC

(n=22)

Metastatic Ca

(n=13)

Abscess

(n=6)


n % N % n % N % n %
Size
        ≤3 cm 4 100.0 1 33.3 0 0.0 0 0.0 1 16.7 0.001s
        >3 cm 0 0.0 2 66.7 22 100.0 13 100.0 5 83.3
SOL
        Single 1 25.0 1 33.3 12 54.5 2 15.4 4 66.7 0.122ns
        Multiple 3 75.0 2 66.7 10 45.5 11 84.6 2 33.3
Diagnosis
        Primary 0 0.0 0 0.0 13 59.1 0 0.0 0 0.0
        Secondary 3 75.0 2 66.7 6 27.3 12 92.3 0 0.0 0.001s
        Not diagnosed 1 25.0 1 33.3 3 13.6 1 7.7 6 100.0


Table VI: Association between cytological diagnosis with cell block (n=42)


Cell block Cytological diagnosis
Negative

(n=4)

Hepatocellular dysplasia

(n=3)

HCC

(n=22)

Metastatic Tumour

(n=13)

Inconclusive
n % N % n % n %
Negative for malignah 3 75.0 0 0.0 0 0.0 0 0.0 0
Hepatocellular dysplasia 0 0.0 2 66.7 0 0.0 0 0.0 0
HCC 0 0.0 1 33.3 20 90.9 0 0.0 0
Metastatic tumour 0 0.0 0 0.0 0 0.0 8 61.5 0
Inconclusive 1 25.0 0 0.0 2 9.1 5 38.5 0


Figure 1. Sex distribution of the study patients


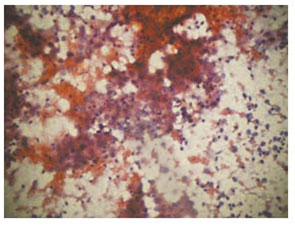
Figure 2. Photomicrograph showing hepatocellular carcinoma (Cytology, Pap stain x40)


Figure 3. Photomicrograph showing hepatocellular carcinoma (Cell Block, H&E stain x20)


Figure 4. Photomicrograph showing hepatocellular carcinoma (Cell Block, H&E stain x10)


Figure 5. Photomicrograph showing adenocarcinoma (Cell Block, H&E stain x40)


Figure 6. Photomicrograph showing adenocarcinoma (Cytology, H&E stain x20)

 Discussion

Liver diseases particularly neoplasia  form focal lesion and are often asymptomatic. Even relevant biochemical tests may not show significant changes.13 Diagnosis and management of space occupying lesions in liver is a great challenge. The present study was carried out to evaluate the space occupying lesion of liver by USG guided FNAC.

The mean age of this study cases with hepatic SOL was forth to fifth decades. In Bangladesh Rahman et al (2014)14 showed similar observations. Similar findings were also observed by Nasit et al (2013)3 in India and Nazir et al (2010)4 in Pakistan. In this study, the incidence was more in male than female. According to World Factbook 2014, the finding is similar. In Asia socioeconomic condition and lifestyle favour exposure to hepatitis more in male than female. Risk factors for HBV and HCV infection such as transfusion related spread, sharing  of needle and syringes which is common for drug abuser, unprotected sex etc are more prevalent in male.18

Common clinical features were abdominal pain, lump and other constitutional symptom. Most of the patients with HCC presented with only abdominal pain. In metastatic group abdominal pain was frequently accompanied by lump in abdomen. Most of the patients with abscess presented with the complain of abdominal pain.  Similar observations regarding the clinical presentations were observed in the study done by Nasit et al (2013)3 and Hossain et al (2010).15

Viral marker was significantly positive in patients with hepatic malignancy. Half of the patients with HCC were HBsAg positive and 9% were anti-HCV positive in this study. Rahman et al (2014)13 and Rahman et al (2010)15 also observed similar findings in Bangladesh.

In present study, most of the cytological diagnosis cases of metastatic carcinoma  had multiple SOL in USG. Similar findings regarding distribution of cases according to cytological diagnosis was observed by Mohammed et al (2013)18 and Najir et al (2010). Hepatocellular carcinoma were more than metastatic neoplasm. Also metastatic cases include mostly adenocarcinoma. Similar findings regarding distribution of cases according to cytological diagnosis was observed by Mohammed et al (2013)15 and Najir et al (2010).4 To evaluate the accuracy of USG guided FNAC in hepatic SOL, the cytological diagnosis was compared with cell block.  Dysplastic nodules are precursor lesions of HCC and need careful evaluation. In such difficult cases cell block can help in examining architectural pattern as well as ancillary studies. Sometimes cirrhosis, progressing to HCC may have SOL. Cytology of cirrhosis may reveal pleomorphism, multinucleation, stippled cytoplasm and mimic HCC. Cell block in these cases show  hepatocytes and bile duct epithelial cells in monolayered sheets.  Other pitfall of FNAC related to  the diagnosis of well differentiated HCC and poorly differentiated HCC to be distinguished. Architectural pattern, thickening of cell plate, lining and traversing endothelial cell can determine and differentiate in such cases.18 Thus, cell block in addition to smears improve the diagnostic performance and decrease the non diagnostic result.

Conclusion

Treatment modalities are rapidly developing worldwide. Long term survival requires detection of small tumors. The patients with chronic liver diseases and other known primary need regular and proper evaluation. FNAC is a safe, minimum invasive procedure and multiple sample can be obtained with the small diameter needle. FNA cytology in case of SOL of liver can be  relied upon to differentiate between benign and malignant lesion and also from primary from secondary. However the indeterminate or  inconclusive report is a pitfall , which needs to be minimized. The result can be improved considering with availablity  of cell block examination. To get maximum benefit combined approach of FNAC and cell block   can be applied.

References

  1. Leiman G, Liver and Spleen. In: Ovell SR, Stennet GF, Whitaker D, editors. Fine needle aspiration cytology. 3rd New Delhi: Churchil Livingstone; 2003. pp 293-316.
  2. Swamy M. Arathi CA and Kodardaswamy CR. Value of ultrasonography-guided fine needle aspiration cytology in the investigative sequence of hepatic lesions with an emphasis on hepatocellular carcinoma. J. Cytol, 2011, 28(4): 178-184.
  3. Nasit J, Patel V, Parikh B, Shah M, Davara K. Fine-needle aspiration cytology & biopsy in hepatic masses: A minimally invasive diagnostic approach. Clin cancer investig J 2013; 2: 132-42.
  4. Nazir R, Sharif M, Iqbal M and Amin M. Diagnostic Accuracy of Fine Needle Aspiration Cytology in Hepatic Tumors. J of the college of Physicians & surgeons Pakistan 2010; 20(6): 373-376.
  5. Conrad R, Castelino-Prabhu S, Cobb C, Raza A. Cytopathologic diagnosis of liver Mass lesions. J of Gastrointestinal Oncology, 2013; 4(1): 53-61.
  6. Asghar F &Riaz S. Diagnostic Accuracy of percutaneous cytodiagnosis of Hepatic Masses by Ultrasound guided Fine Needle Aspiration Cytology. 2010, ANNALS,16:184-188.
  7. Ng J. Wuu J. Hepatitis B related and Hepatitis C related Hepatocellular Carcinoma in the United States; Similarities and Differences Hepat Mon, 2012, 7635.
  8. Venook AP, Papandreou C, Furuse J, Guevara L.L.D. The incidence and epitemiology of Hepatocellular carcinoma: A Global and Regional Perspective. The Oncologist, 2010; 15 (Suppl 4):5–13.
  9. Liu Z, Hou J. Hepatitis B Virus (HBV) and Hepatitis C Virus (Hq) Dual infection. Int J. Med Sci 2006; 3(2):57–62.
  10. Sanyal AJ, Yoon SK and Lencioni R. The Etiology of Hepatocellular Carcinoma and Consequences for Treatment. The Oncologist, 2010; 15 (suppl 4) 14–22.
  11. Haque S, Dilawar A and Subzwari J. Ultrasound Guided Fine-Needle Aspiration Biopsy of Metastatic Liver Disease: A Comparative Assessment of Histological & Cytological Techniques. 2012; 28:49-55.
  12. Nathan N, Narayan E, Smith M and Muuray J Cell Block Cytology: Improved preparation and its Efficacy in Diagnostic Cytology. American Society of Clinical Pathologists, 2000; 114:599-606.
  13. Evaluation of focal Liver Lesions by Ultrasound as a Prime Imaging Modality. Scholars Journal of Applied Medical Science (SJAMS), 2013; 6(6):1041-1059.
  14. Rahman F. Role of Cytology .Cell block and Immunohistochemistry in Differentiating Hepatocellular Carcinoma from MetastaticTumors in Liver.Unpublished MD thesis, 2014; BSMMU, Bangladesh.
  15. Hossain M. Characterization of Focal liver mass by computed Tomography scan with Cytopathological Correlation. Unpublished MD thesis, 2010; BSMMU, Bangladesh.
  16. Rahman AA. Prevalence of Primary HCC &Secondaries in liver in it attending Dept of Gastr&Hepatology in BSMMU. Unpublished MD thesis,2010; BSMMU, Bangladesh.
  17. Charles E, Ray MD, William S, Rilong MD (2006) Current Imaging Strategies of primary & Secondary Neoplasm of the liver. Sem: Int: Rad: Mar: 2006; 23(1):3-12.
  18. Mohammed AA Elsiddig S, Abdul Hamid M, Gasim G and Adam I. Ultrasound guided fine needle aspiration cytology and cell block in the diagnosis of focal liver lesions at Khartoum Hospital, Sudan. 2012;7:
  19. Barbhaiya M. Bhunia S, Kakka M, et al. Fine Needle Aspiration Cytology of lesions of liver and gallbladder: An analysis of 400 consecutive aspirations. J Cytol, 2014; 31(1): 20-24.


Significance of Glomerular PAS Positive Matrix Deposition in Glomerulonephritis

Significance of Glomerular PAS Positive Matrix Deposition in Glomerulonephritis

*Das RK,1 Kabir AN,2 Begum F,3 Khanam A,4 Kamal M5

Abstrat:

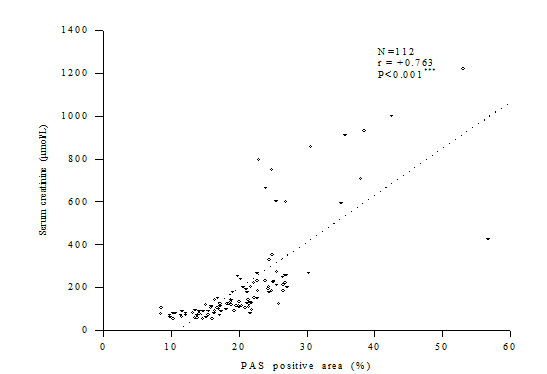
This study was done with the aim to calculate the glomerular PAS positive material quantitatively in glomerulonephritis and to find out its correlation with renal function. A total of 112 cases of glomerulonephritis were included in this study and morphometric measurements of the percentages of glomerular PAS positive areas were performed in a computer with a specially constructed grid. The mean of these values was scored from 1-4 according to the degree of PAS positive material deposition. With the increase of glomerular PAS positive score the levels of blood urea and serum creatinine also increased but the levels of creatinine clearance rate decreased. The percentages of glomerular PAS positive areas were correlated with renal functions expressed as levels of blood urea, serum creatinine and creatinine clearance rate. The degree of glomerular PAS positive matrix deposition showed strong positive correlation with levels of blood urea and serum creatinine (r=0.566, p<.0.001 and r=0.763, p=<0.001, respectively). Whereas creatinine clearance rate showed striking inverse relationship with PAS positive areas (r= – 0.612, p<0.001). Thus, the present study confirmed the previous results concerning a significant correlation between these parameters.

[Journal of Histopathology and Cytopathology, 2018 Jan; 2 (1):3-10]

Key words: Glomerulonephritis, PAS positive matrix, morphometry, renal function.


  1. *Dr. Ruhini Kumar Das, Associate Professor, Department of Pathology, M Abdur Rahim Medical College, Dinajpur. dr.ruhini@gmail.com
  2. AKM Nurul Kabir, Associate Professor, Department of Pathology, Bangabandhu Sheikh Mujib Medical University, Dhaka.
  3. Ferdousy Begum, Associate Professor, Department of Pathology, Bangabandhu Sheikh Mujib Medical University, Dhaka.
  4. Anisa Khanam, Associate Professor, Department of Pathology, United Hospital, Dhaka.
  5. Mohammed Kamal, Professor, Department of Pathology, Bangabandhu Sheikh Mujib Medical University, Dhaka.

*For correspondence

Introduction
Chronic glomerulonephritis is one of the most important causes of chronic renal failure, which is the end result of a variety of human kidney diseases and is the major cause of death.1 It is clear that immune mechanism involved in most of the glomerulonephritis and initial target of injury is the glomerulus of kidney causing glomerular structural abnormalities. Other changes such as interstitial fibrosis, inflammatory infiltrate and tubular atrophy are secondary and nonspecific phenomenon, which are related to the degree of glomerular damage.2 Cell proliferation and deposition of different types of extracellular matrix components in the glomerular basement membrane (GBM) and/or in the mesangium characterizes the histology of glomerulus in glomerulonephritis.3 These changes in the glomerular basement membrane (GBM) and mesangiumare characterized by expansion of all the intrinsic extracellular matrix components due to increased production, decreased turnover or both of these components.4 Immunohistochemical techniques have demonstrated that glomerular extracellular matrix comprises laminin, fibronectin, entectin, heparansulfate, chondroitin sulfate, decorine and various types of collagen.2 Glomerular extracellular matriceses are PAS positive therefore the amount of  PAS positive material deposition can reflect the severity of glomerular injury and has been claimed important in  predicting renal function in glomerulonephritis.2 Series of histomormphometric studies established that the severity of renal failure in various types of glomerulopathy closely related with the severity of the tubulointerstitial changes, whereas the correlation with glomerular abnormalities is absent or weak.5-11 Critics of these studies were that the severity of interstitial abnormalities was evaluated by quantitative methods whereas the glomerular pathology was studied by semi-quantitative technique.2 Many investigators became puzzled by this apparent lack of correlation between glomerular abnormalities and renal failure although the glomerular pathology is the more important factor in glomerulonephritis and performed the quantitative study with particular interest to the deposition of glomerular PAS positive material. Some studies demonstrated that both glomerular and interstitial extracellular matrix accumulation contribute in impairment of kidney function. In the glomeruli PAS positive extracellular matrix deposition seems to be particularly important and correlate strongly with renal failure,2,4 whereas other failed to find such correlation.13 Therefore, the glomerular deposition of PAS positive matrix is reflected in renal failure has become a controvertial issue. This study was carried out with the aim to calculate the glomerular PAS positive material (% of total glomerular areas) by quantitative technique in glomerulonephritis and to find out its correlation with renal function to confirm this condrovertial issue.

 Methods

Patients
This study was carried out in the Department of Pathology, Bangabandhu Sheikh Mujib Medical University (BSMMU), Dhaka. The renal tissues that were examined were collected for clinical purposes by percutaneous kidney biopsy by a surgical procedure. 112 patients of glomerulonephritis, where renal biopsy revealed variable degrees of increased mesangial cells, matrix, hyalinization and sclerosis were selected for this study. Renal tissues containing at least five glomeruli in haematoxylin & eosin stained sections were considered as adequate for evaluation. Blood urea, serum creatinine and creatinine clearance rate (Ccr) were done at the time of biopsy to assess the excretory function of kidney.

 Light Microscopy

Tissue for light microscopic examination was fixed in 10% formalin and processed routinely. Sections were cut 4-5 µm thickness from paraffin embedded material and stained by haematoxylin and eosin, periodic acid Schiff (PAS), Masson’s trichrome and methenamine silver (Jones) stains.

Immunofluorescence Microscopy

Renal biopsy specimens were embedded in O.C.T. compound, rapidly frozen, then sectioned at 5µm thickness in a cryostat at -200c.  The sections were stained with FITC conjugated rabbit anti-sera against human IgG, IgM, IgA, C3 and fibrinogen. The sections were then viewed under fluorescence microscope.


Figure 1. A grid superimposed on a glomerulus in the biopsy of a patient with mesangiocapillary glomerulonephritis using Adobe illustrator 8.0. Total 48 points superimposed on glomerular area within Bowman’s capsule, 9 points superimposed on PAS positive area. The resulting PAS positive area was 18.8%.

Morphometry

Histomorphometry was performed by means of an image analysis system in a computer using Adobe Illustrator 8.0. Glomerular deposition of PAS positive material (% of total glomerular area) was measured quantitatively by morphometric examination of three to five glomeruli in PAS stained sections. Tangentially cut glomeruli were excluded. A section in which the apparent diameter was <50% of maximum diameter was defined as tangential section. The quantitative examination included the areas of glomerular deposition of PAS positive material of the total glomerular area. This was performed by means of a point counting method, which has been described as an accepted standard for histomorphometric evaluation. Colour microphotographs were taken by means of an Olympus digital camera (DP 11, Japan) which was attached to an Olympus microscope (BX51TF, Japan). The original magnification was 200 X. The colour microscopic images were transferred to a computer and saved in the memory. A grid was prepared in the computer using Adobe Illustrator 8.0. The space between the intersecting points of the grid was 6.25 mm. The total number of points of the grid was 169, and total area was 5625 sq.mm. The images of a glomerului were reduced to 20% of its original size and the grid projected over it (Fig. 1). The total glomerular areas were determined by counting the numbers of intersecting points superimposed on glomerular areas within Bowman’s capsule. The percentage of PAS positive material was represented by numbers of points falling on PAS positive material as percentage of total points falling on total structure within Bowman’s capsule. To minimize the error each glomerulus was measured three times by changing the position of grid. The mean of these values for each glomerulus was calculated and scored from 1- 4 according to degree of PAS positive areas (Table I).


Table I:  Scoring system of glomerular PAS positive material

Glomerular PAS positive area. Score
Up to 10% of the glomerular PAS positive area 1
>10-25% of the glomerular PAS positive area 2
>25-50% of the glomerular PAS positive area 3
>50% of the glomerular PAS positive area 4


Statistics

The correlations of glomerular PAS staining areas with renal function were determined with Pearson’s correlation method. Results were statistically significant if p <0.05.

 Results

Of the total 112 cases, 55 (49.1%) were mesangial proliferative glomerulonephritis (Mes PGN), 45 (40.2%) were mesangiocapillary glomerulonephritis (MCGN), 8 (7.1%) were IgA nephropathy (IgAN), 3 (2.7%) were membranous glomerulonephritis (MGN) and 1 (0.9%) was chronic glomerulonephritis (CGN). The glomerular PAS positive material ranged from 8.46% to 56.73% with a mean value of 20.71 ± 7.9%. The mean values of glomerular PAS positive areas in MesPGN, MCGN, IgA nephropathy, MGN and CGN were 19.46 ± 6.3%, 22.31 ± 8.1%, 15.69 ± 3.9%, 31.05 ± 22.3% and 27.04% respectively. PAS positive areas were scored from 1 to 4 (Table II).

 Table II: Score of glomerular PAS positive areas


Score PAS  positive area

(Mean ± SD)

No. of patients

n = 112

        1 9.14 ± 0.77% 4
        2 18.31 ± 4.05% 85
        3 29.38 ± 5.25% 21
        4 54.88 ± 2.61% 2

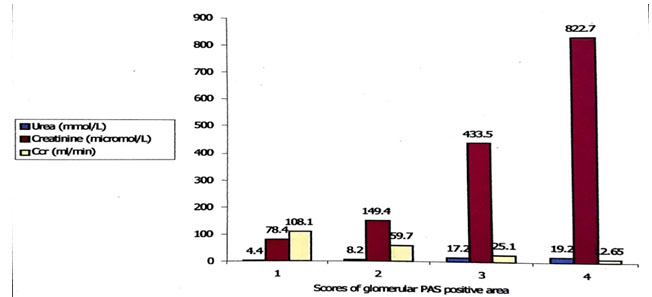
 Out of 112 cases estimation of blood urea was done in 107 cases, creatinine clearance ratevin 100 cases and serum creatinine in all of the cases. It was observed that with the increase of glomerular PAS positive score the levels of blood urea and serum creatinine also increased whereas the levels of Ccr decreased (Fig. 2). Glomerular PAS positive areas showed significantly strong positive correlation with the levels of blood urea and serum creatinine (r = 0.566, p <0.001 and r = 0.763, p <0.001, respectively), whereas with Ccr the relationship was significantly inverse (r = – 0.612, p < 0.001) (Fig. 3-5).


Figure 2. Result of renal function tests according to score of PAS positive areas

Figure 3. Correlation between glomerular PAS positive area and blood urea


Figure 4. Correlation between glomerular PAS positive area and serum creatinine


Figure 5. Correlation between glomerular PAS positive area and creatinine clearance rate

 Discussion

In many of the glomerulonephritis there is deposition of PAS positive extracellular matrix in GBM and mesangium and glomerular PAS positive areas correlate with renal function expressed as blood urea, serum creatinine and creatinine clearance.

With this aim Suzuki in 1994 performed a quantitative study on diabetic nephropathy. He stained glomerular mesangial deposition of various glycoproteins with PAS and measured the positive areas by an automatic image analyzer. He correlated the percentages of glomerular PAS positive areas with serum creatinine and found significant correlation.4


In 1997, Vleming and co-authors performed a quantitative study on various forms of glomerular diseases to find out the correlation of glomerular PAS positive areas with renal function. They found that the percentages of glomerular PAS positive areas correlated strongly with renal insufficiency expressed as serum creatinine.2

In view of the same aim Danilewicz and Wagrowska Danilewicz in 1997 carried out a quantitative study on three forms of proliferative glomerulonephritis MesPGN, MCGN and IgA nephropathy. They failed to demonstrate any significant correlation between glomerular PAS positive matrix deposition and serum creatinine. These investigators found that correlation between these parameters tended to be positive but have not reached statistical significance. They could not agree with the earlier findings of Vleming et al 1997 and stated that in their study patients biopsies contained a mixed bag of diagnosis. Therefore, this would require external validation of their findings in a cohort of patient with one disease.13

Vleming and co-authors in 1998 performed another quantitative study with a single disease entity for confirmation of their previous findings of significant positive correlation of glomerular PAS positive material with renal function. IgA nephropathy was selected and obtained significant correlation between glomerular PAS positive areas and creatinine clearance rate at the time of biopsy.14

The present study was performed to measure glomerular PAS positive material quantitatively and to determine whether this parameter correlates with renal function. It was observed that with the increase of PAS positive scores the level of blood urea and serum creatinine also proportionately increased whereas the level of creatinine clearance rate decreased. The glomerular PAS positive areas correlated strongly with the levels of blood urea, serum creatinine and Ccr. Our results correspond to the observation of Vleming et al. 1997, Vleming et al. 1998 and Suzuki 1994. The findings of present study only differ with the study of Danilewicz et al. 1997. They did not find significant correlation between PAS positive areas and serum creatinine in MesPGN, MCGN and IgAN. Total number of cases in their study was small and they have included only less severe cases of glomerulonephritis. This may be the possible cause of insignificant correlation in their study.

Conclusion

It was concluded that the severity of glomerular PAS positive matrix accumulation in glomerulonephritis correlated with the severity of renal insufficiency and our study confirmed the results previously obtained by different observers concerning significant correlation between these parameters.

Acknowledgment

We acknowledge Bangladesh Medical Research Council (BMRC) for their support by a research grant for this study under WHO Research Programme.

 References

  1. Cotran RS, Kumar V, Collins T. (Eds). Robbins Pathologic Basis of Disease, 6th Philadephia: WB Saunders, 1999: 931-64.
  2. Vleming LJ, Baelde JJ, Westendorp RGJ, Daha MR, Es van LA, Bruijn JA and Bruijn JA. The Glomerular deposition of PAS positive material correlates with renal function in human kidney diseases. Clin Nephrol, 1997; 47: 158-167.
  3. Glick AD, Jacobson HR, Haralson MA. Mesangial deposition of type 1 collagen in human glomerulosclerosis. Hum pathol, 1992; 23: 1373-7.
  4. Suzuki D. Measurement of the extracellular matrix in glomeruli from patients with diabetic nephropathy using an automatic image analyzer. Japanese Journal of Nephrology, 1994; 36 (11): 1209-1215.
  5. Risdon RA, Sloper JC, De Wardener HE. Relationship between renal function and histological changes found in renal-biopsy specimens from patients with persistent glomerulonephritis. Lancet, 1968; 2: 363-366.
  6. Schainuch LI, Striker GE, Cuter RE, Bendin EP. Structural-functional correlations in renal diseases. II. The correlations. Hum Pathol, 1970; 1:630-641.
  7. Bohle A, Mackensen-Heam S, von Gise H. Significance of tubulointerstitial changes in the renal cortex for the excretory function and concentration ability of the kidney. A morphometric comparison. Am J Nephrol, 1987; 7: 42-433.
  8. Mackensen-Heam S, Bohle A, Christensen J, Wehrmann M, Kendjiora H, Kokot F. The consequences for renal function of widening of the interstitium and changes in the tubular epithelium of the renal cortex and outer medulla in various renal diseases. Clin Nephrol, 1992; 37:70-77.
  9. Lane PH, Steffes MW, Fioretto P, Mauer M. Renal interstitial expansion in insulin-dependent diabetes mellitus. Kidney International, 1993; 43: 661-667.
  10. Steffes MW, Bilous RW, Sutherland DER, Mauer SM. Cells and matrix components of the glomerular mesangium in type I diabetes. Diabetes, 1992; 41:679-84.
  11. Mauer SM, Steffes MW, Ellis EN, Sutherland DE, Brown DM, Goetz FC. Structural-functional relationships in diabetic nephropathy. J Clin Invest, 1984; 74:1143-1155.
  12. Thomsen OF, Andersen AR, Christiansenis A and Deckert T. Renal changes in long-term type I (insulin-dependent) diabetic patients with and without clinical nephropathy: a light microscopic, morphometric study of autopsy material. Diabetilogica, 1984; 26: 361-365.
  13. Danilewicz M and Wagrowska- Danilewicz M. The consequences for renal function of the glomerular deposition of PAS positive material in proliferative glomerulopathies. A quantitative study. Gen Diag Pathol, 1997; 143: 225-230.
  14. Vleming LJ, Fijter DE JW, Westendorp RGJ, Daha MR, Bruijn JA and Es van LA,. Histomorphometric correlates of renal failure in IgA nephropathy. Clin Nephrol,1998;49:337-344.